. 2012 Jun;166(3):1069-83.
doi: 10.1111/j.1476-5381.2011.01816.x.

Access of inhibitory neurosteroids to the NMDA receptor

Affiliations

Access of inhibitory neurosteroids to the NMDA receptor

Jirina Borovska et al. Br J Pharmacol. 2012 Jun.

Abstract

Background and purpose: NMDA receptors are glutamatergic ionotropic receptors involved in excitatory neurotransmission, synaptic plasticity and excitotoxic cell death. Many allosteric modulators can influence the activity of these receptors positively or negatively, with behavioural consequences. 20-Oxo-5β-pregnan-3α-yl sulphate (pregnanolone sulphate; PA-6) is an endogenous neurosteroid that inhibits NMDA receptors and is neuroprotective. We tested the hypothesis that the interaction of PA-6 with the plasma membrane is critical for its inhibitory effect at NMDA receptors.

Experimental approach: Electrophysiological recordings and live microscopy were performed on heterologous HEK293 cells expressing GluN1/GluN2B receptors and cultured rat hippocampal neurons.

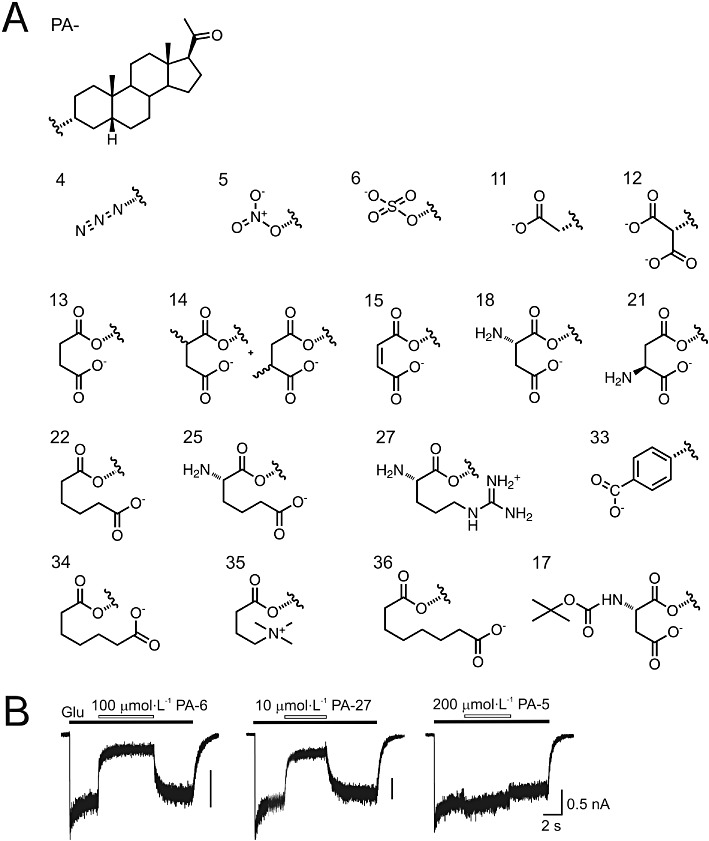
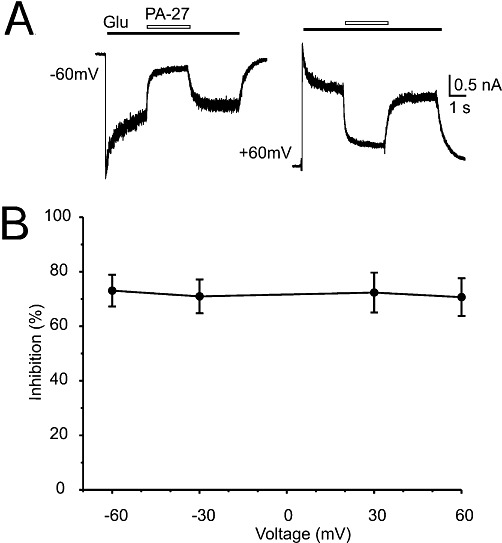
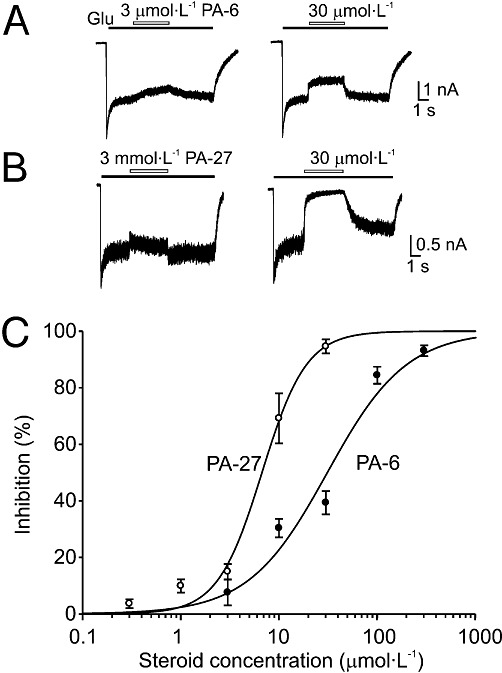
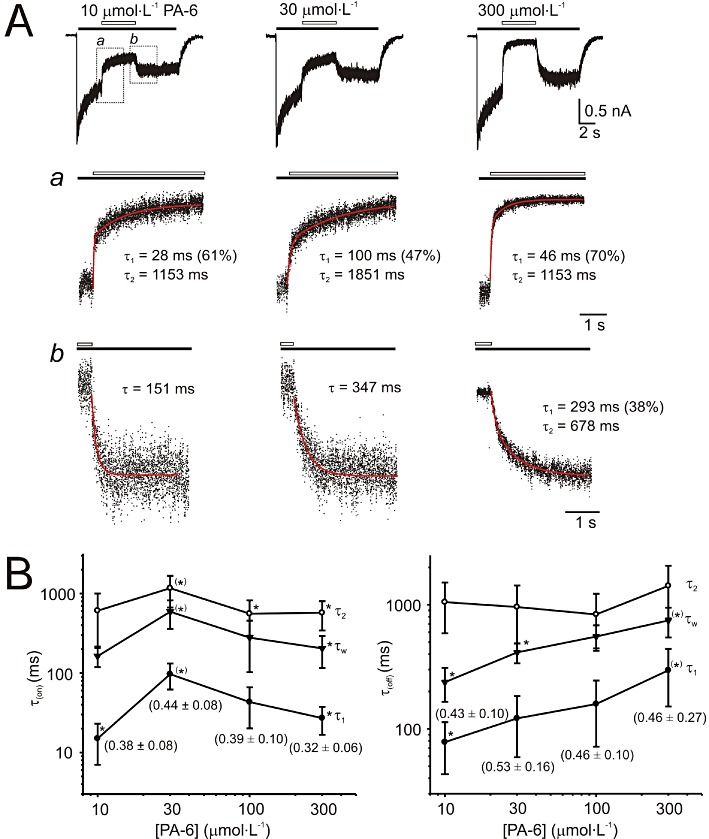
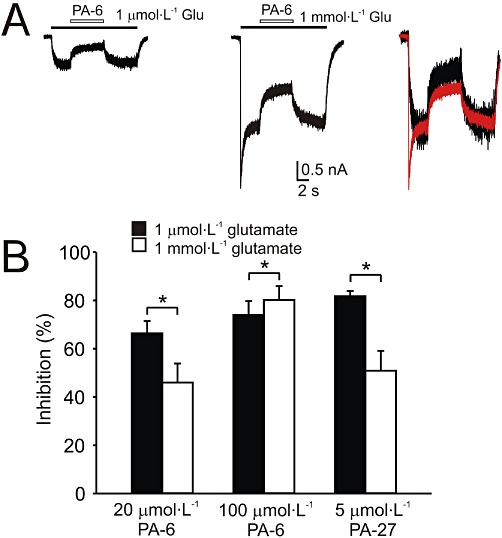
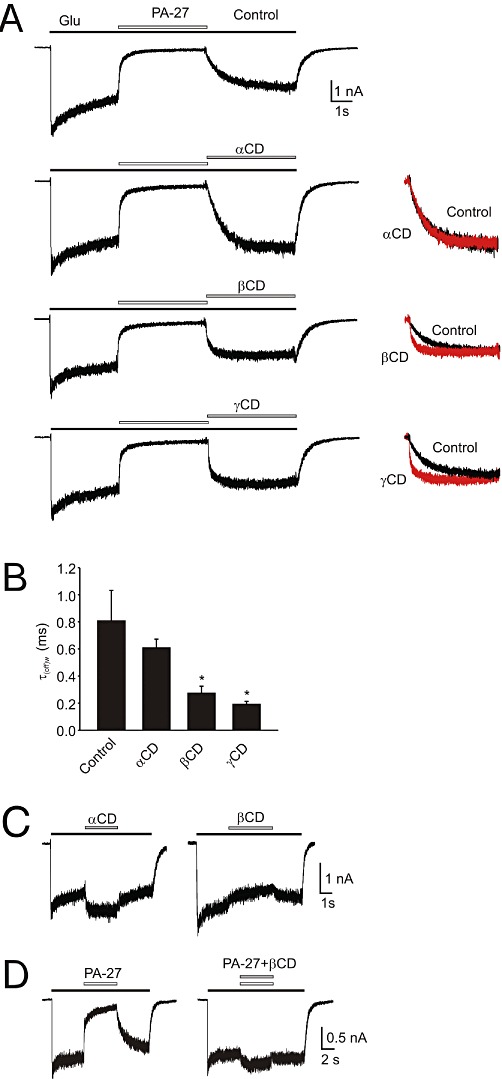
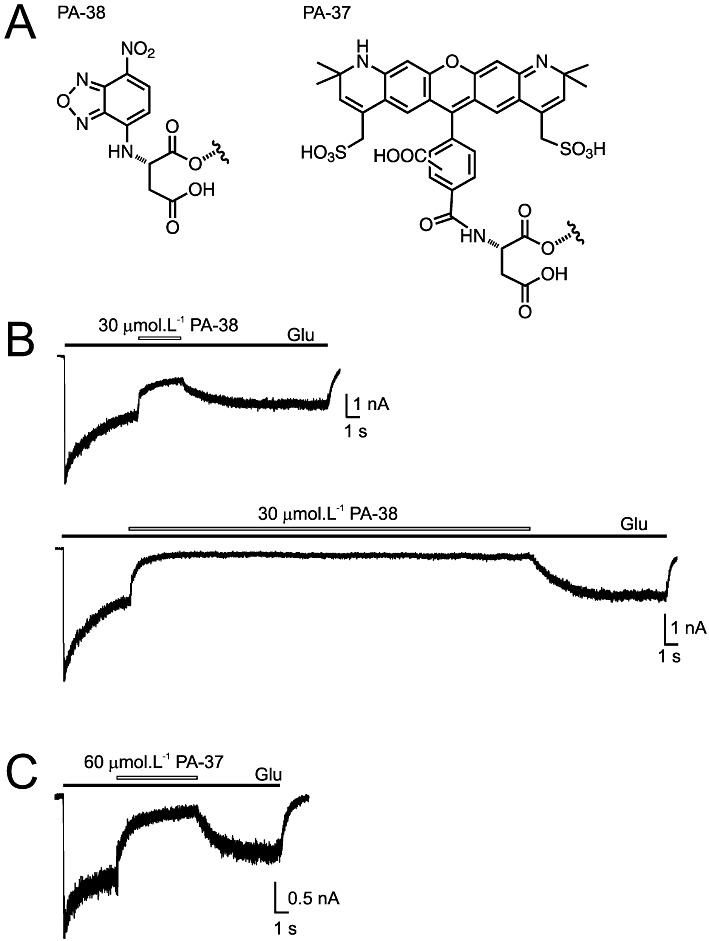
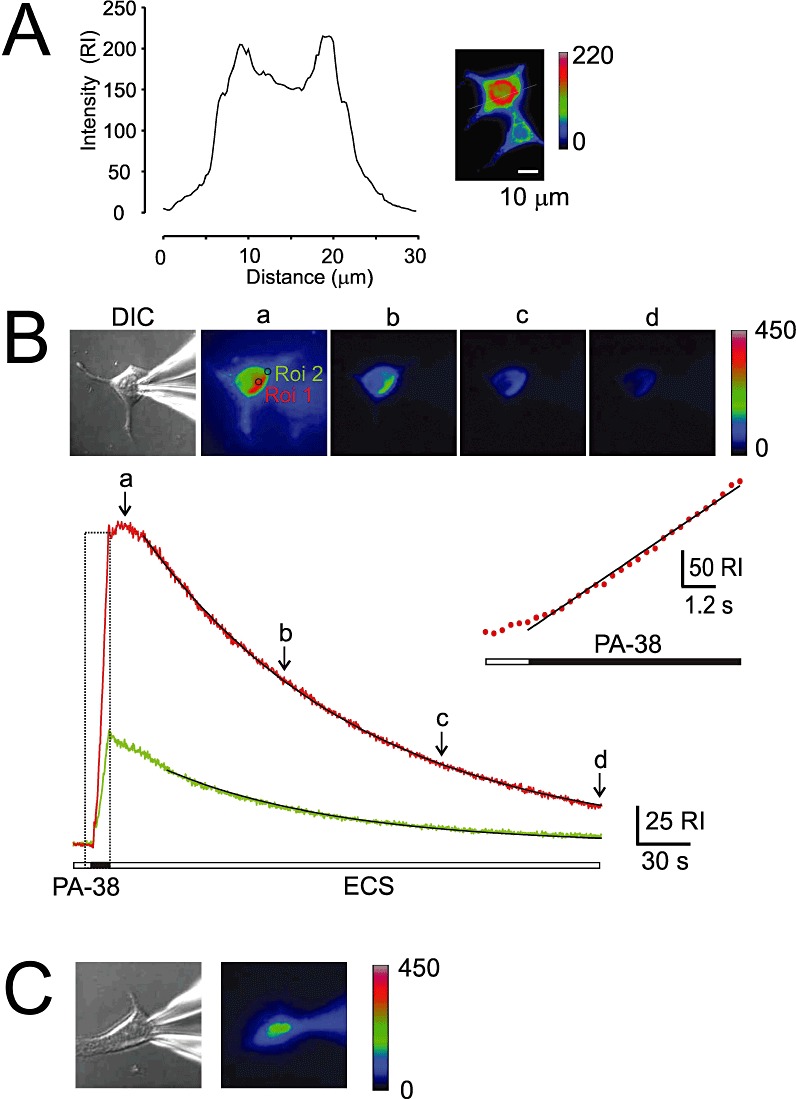
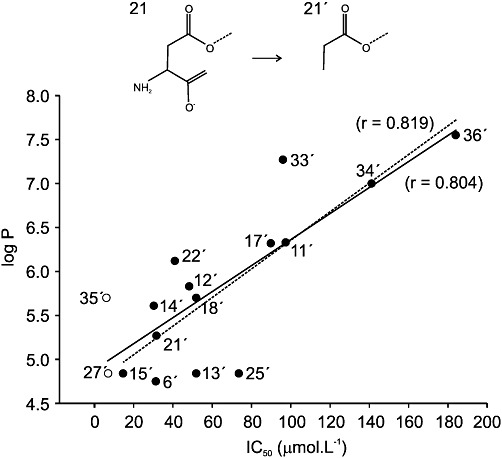
Key results: Our experiments showed that the kinetics of the steroid inhibition were slow and not typical of drug-receptor interaction in an aqueous solution. In addition, the recovery from steroid inhibition was accelerated by β- and γ-cyclodextrin. Values of IC(50) assessed for novel synthetic C3 analogues of PA-6 differed by more than 30-fold and were positively correlated with the lipophilicity of the PA-6 analogues. Finally, the onset of inhibition induced by C3 analogues of PA-6 ranged from use-dependent to use-independent. The onset and offset of cell staining by fluorescent analogues of PA-6 were slower than those of steroid-induced inhibition of current responses mediated by NMDA receptors.

Conclusion and implications: We conclude that steroid accumulation in the plasma membrane is the route by which it accesses a binding site on the NMDA receptor. Thus, our results provide a possible structural framework for pharmacologically targeting the transmembrane domains of the receptor.


Figures

Figure 1
Figure 1
Chemical structures of steroids tested for biological activity at NMDA receptors. (A) Structure of 5β-20-oxo-pregnane (PA) and residues substituted in the position of carbon C3 (A-S). (B) Examples of traces obtained from HEK293 cells transfected with cDNAs encoding NR1/NR2B receptor subunits. PA-6 (100 µmol·L−1), PA-27 (10 µmol·L−1) and PA-5 (200 µmol·L−1) were applied simultaneously with 100 µmol·L−1 glutamate (duration of steroid and glutamate application is indicated by filled and open bars respectively).
Figure 2
Figure 2
PA-27 is a voltage-independent inhibitor of NMDA receptors. (A) Examples of responses induced by glutamate (1 mmol·L−1) in HEK293 cells expressing NR1/NR2B receptors, recorded at −60 and +60 mV. The glutamate-evoked currents recorded at each of the membrane potentials indicated are reversibly inhibited by co-application of PA-27 (10 µM) at the point indicated by the open bar. (B) Plot of the mean inhibition induced by PA-27 versus holding potential. Note that PA-27-induced inhibition was not affected by membrane potential.
Figure 3
Figure 3
Concentration-dependent inhibition by PA-6 and PA-27 at NR1/NR2B receptors. Examples of traces obtained from HEK293 cells expressing recombinant NMDA receptors activated by 100 µmol·L−1 glutamate and its co-application with 3 and 30 µmol·L−1 PA-6 (A) and 3 and 30 µmol·L−1 PA-27) (B) (duration of glutamate and steroid is indicated by an open and filled bars respectively). (C) Concentration-response curves for the PA-6 and PA-27 effect at NR1/NR2B receptors. Steroid-induced inhibition was fitted to the following logistic equation: I= 1/(1([PA]/IC50)h), where IC50 is the concentration of steroid that produces a 50% inhibition of agonist-evoked current, [PA] is the PA-6 or PA-27 concentration, and h is the apparent Hill coefficient. Smooth curves are calculated from the mean values (PA-6 IC50= 31.1 µmol·L−1, Hill coefficient = 1.1, n= 5; PA-27 IC50= 6.8 µmol·L−1, Hill coefficient = 1.9, n= 7). Data shown are means ± SD.
Figure 4
Figure 4
Use-dependent and use-independent inhibition of NMDA receptor channels by steroids. The Figure shows examples of records obtained from HEK293 cells transfected with NR1 and NR2B subunits. (A) On the left, response to co-application of 300 µmol·L−1 PA-6 and 1 mmol·L−1 glutamate (Glu) made after the onset of the response to the agonist was inhibited by 97% and recovered from the inhibition on a slow timescale. In the middle, the onset of the response to application of 1 mmol·L−1 glutamate made immediately after pre-application of 300 µmol·L−1 PA-6 for 10 s was rapid, similar to the control glutamate response. (B) On the left, response to co-application of 30 µmol·L−1 PA-27 and 1 mmol·L−1 glutamate (Glu) made after the onset of the response to the agonist was inhibited by 98% and recovered from the inhibition on a slow timescale. In the middle, the onset of the response to application of 1 mmol·L−1 glutamate made immediately after pre-application of 30 µmol·L−1 PA-27 for 10 s was slow, similar to the recovery after PA-27 and glutamate co-application. (C) On the left, response to co-application of 200 µmol·L−1 PA-22 and 1 mmol·L−1 glutamate (Glu) made after the onset of the response to the agonist was inhibited by 95% and recovered from the inhibition on a slow timescale. In the middle, the onset of the response to application of 1 mmol·L−1 glutamate made immediately after pre-application of 200 µmol·L−1 PA-22 for 10 s was complex characterized by biphasic response – the first being fast and the second slow. (A-C) On the right, recovery from inhibition induced by steroid and glutamate co-application (in red) and steroid pre-application (in black) are displayed overlaid to show the difference in the rate of recovery. Note that the recovery from inhibition was similar for all three steroids; in the case of co-application, there were differences in the recovery after the steroid application.
Figure 5
Figure 5
Analysis of the time course of the onset and offset of PA-6-induced inhibition. (A) Whole-cell responses to 12 s application of 1 mmol·L−1 glutamate (indicated by filled bar) recorded from HEK293 cells expressing NR1/NR2B receptors and its co-application with 10, 30, and 300 µmol·L−1 PA-6 (indicated by open bar). Normalized onset of responses to PA-6 (represented by dots) is shown in (a) on expanded time scale and the fit by a double exponential function [indicated by superimposed red line; values of the fast component (τ1) with its relative contribution indicated in parentheses and the slow component (τ2)] are attached. Normalized offset of responses to PA-6 is shown in (b) on expanded time scale and the fit by a double exponential function [indicated in red; values of the fast component (τ1) with its relative contribution indicated in parenthesis and the slow component (τ2)] are attached. Plot of the concentration dependence of the mean time constants ± SD (τ1, τ2 and both components weighted τw) describing onset and offset (B) of PA-6-induced inhibition for 6 cells analysed. Relative contribution of the slow component is attached (mean ± SD). *P < 0.05, significantly different from values marked †; one-way anova with post hoc Tukey's test. No differences were found in the relative amplitude of τ1 and τ2 describing onset and offset of PA-6-induced inhibition. Note bell-shape of the dependence of time constants describing the onset of inhibition and slowdown of recovery of steroid-induced inhibition as a function of PA-6 concentration.
Figure 6
Figure 6
The effect of steroids on responses induced by low and high concentration of glutamate. (A) Example of responses induced by 1 µmol·L−1 and 1 mmol·L−1 glutamate in HEK293 cells expressing NR1/NR2B receptors. The responses diminished during co-application with 20 µmol·L−1 PA-6 by 64 and 42% respectively. On the right, both responses are displayed overlaid and normalized to show the difference in the degree of steroid-induced inhibition. (B) Bar graph represents mean ± SD (n= 5–7 cells) inhibition by PA-6 (20 µmol·L−1, 100 µmol·L−1) or PA-27 (5 µmol·L−1) of responses induced by glutamate (1 µmol·L−1, 1 mmol·L−1). *P < 0.001, significantly different from 1 µmol·L−1 glutamate; paired t-test. Note that 20 µmol·L−1 PA-6 was a more powerful inhibitor of responses induced by 1 µmol·L−1 glutamate, whereas at 100 µmol·L−1 it was a more powerful inhibitor of responses induced by 1 mmol·L−1 glutamate.
Figure 7
Figure 7
Cyclodextrin effects on the rate of recovery from PA-27-induced inhibition. (A) Example of a response to 1 mmol·L−1 glutamate and its co-application with 10 µmol·L−1 PA-27 (Control), and that recorded in the presence of 10 mmol·L−1α-cyclodextrin (αCD), 10 mmol·L−1β-cyclodextrin (βCD) or 10 mmol·L−1γ-cyclodextrin (γCD). On the left, recovery recorded in the absence of cyclodextrin (Control) and that recorded in the presence of cyclodextrin (in red) are shown normalized and superimposed. Note that the rate of recovery from PA-27-induced inhibition was accelerated in the presence of βCD and γCD. All records are from the same cell. (B) Summary of the effects of α-, β- and γ-cyclodextrin on the rate of recovery from inhibition induced by PA-27. Abscissa shows mean ± SD of the weighted single or double exponential fit to the recovery after steroid application (n= 5). *P < 0.05, significantly different from Control, paired t-test. (C) Effect of 10 mmol·L−1α- and β-cyclodextrin on 1 mmol·L−1 glutamate-induced responses. (D) Example of a response to 1 mmol·L−1 glutamate and its co-application with 10 µmol·L−1 PA-27 (Control), and that recorded in the presence of mixture of 10 mmol·L−1β-CD and 10 µmol·L−1 PA-27.
Figure 8
Figure 8
Fluorescent 3α5β analogues of PA retain their activity at NMDA receptors. (A) Chemical structures of fluorescent steroids used in electrophysiological and imaging experiments. (B) Inhibition of responses to 1 mmol·L−1 glutamate by co-application with 30 µmol·L−1 PA-38 applied for 3 s and 30 s (indicated by open bar) in HEK293 cells expressing NR1/NR2B receptors. (C) Response to 1 mmol·L−1 glutamate recorded from HEK293 cells expressing NR1/NR2B receptors and its inhibition by 60 µmol·L−1 PA-37.
Figure 9
Figure 9
Imaging analysis of fluorescent steroid analogues. (A) HEK293 cells were stained with 100 µmol·L−1 PA-38 extracellularly applied for 5 s and subsequently washed with ECS for 3 s before the image was acquired. Fluorescence intensity is indicated in pseudocolours. Graph shows relative fluorescence intensity (relative intensity, RI, indicates fluorescence intensity measured outside the cell subtracted from that in the cell) in a cross-section (indicated by a line). (B) HEK293 cell was stained with PA-38 (30 µmol·L−1) extracellularly applied for 8 s. The images of the cell were acquired using DIC and fluorescence microscopy at 300 ms intervals. Analysis of the fluorescence accumulation in two cell regions (R1, perinuclear in red, and R2, cell edge in green) as a function of time. Images were acquired at time intervals indicated (a-d). Time-course of the fluorescence onset (boxed region) was fitted to a linear regression (slope 1632 ± 24 RI·min−1) and is shown on expanded time scale in inset. Time-course of the fluorescence offset was fitted by a single exponential function (2 min perinuclear region; 1.6 min for cell edge region). Note that the fluorescence intensity increased rapidly during steroid application; however, it slowly continued for 10 s after the steroid was removed from the ECS. (C) DIC and fluorescence image of a HEK293 cell acquired 15 min after the start of whole-cell recording and intracellular dialysis with ICS containing 100 µM PA-37.
Figure 10
Figure 10
Correlation between inhibitory effects of steroid analogues and their lipophilicity. The ordinate gives the IC50 for inhibition (see Table 1), and the abscissa shows the lipophilicity index (log P). The lipophilicity index was estimated for steroids in which the part of the carbon skeleton after the first ionized residue of the C3 subsistent was substituted for methyl (e.g. aspartate residue of PA-21 was substituted for propionate). The solid line shows the regression of IC50 on log P (Pearson correlation coefficient, r = 0.804, P = 0.00017) for structures derived from negatively charged (closed symbols) and all charged (open symbols) steroids, whereas the dashed line is the regression (Pearson correlation coefficient r = 0.819, P= 0.00034) for structures derived from only negatively charged steroids.

References

    1. Adam JM, Bennett DJ, Bom A, Clark JK, Feilden H, Hutchinson EJ, et al. Cyclodextrin-derived host molecules as reversal agents for the neuromuscular blocker rocuronium bromide: synthesis and structure-activity relationships. J Med Chem. 2002;45:1806–1816. - PubMed
    1. Akk G, Shu HJ, Wang C, Steinbach JH, Zorumski CF, Covey DF, et al. Neurosteroid access to the GABAA receptor. J Neurosci. 2005;25:11605–11613. - PMC - PubMed
    1. Alexander SPH, Mathie A, Peters JA. Guide to Receptors and Channels (GRAC), 5th Edition. Br J Pharmacol. 2011;164(Suppl. 1):S1–S324. - PMC - PubMed
    1. Besshoh S, Chen S, Brown IR, Gurd JW. Developmental changes in the association of NMDA receptors with lipid rafts. J Neurosci Res. 2007;85:1876–1883. - PubMed
    1. Blouin A, Bolender RP, Weibel ER. Distribution of organelles and membranes between hepatocytes and nonhepatocytes in the rat liver parenchyma. A stereological study. J Cell Biol. 1977;72:441–455. - PMC - PubMed

Publication types

MeSH terms

Substances