

Best practice guidelines for monitoring socioeconomic inequalities in health status: lessons from Scotland
- PMID: 22188351
- PMCID: PMC3250637
- DOI: 10.1111/j.1468-0009.2011.00646.x
Best practice guidelines for monitoring socioeconomic inequalities in health status: lessons from Scotland
Abstract
Context: In this article we present "best practice" guidelines for monitoring socioeconomic inequalities in health status in the general population, using routinely collected data.
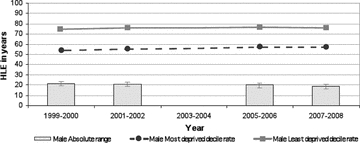
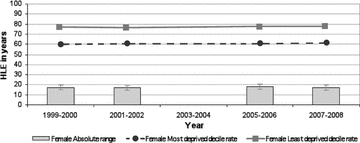
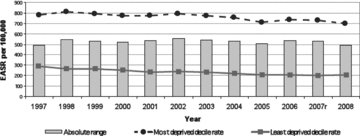
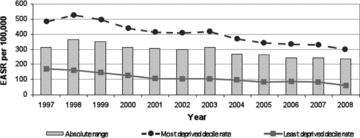
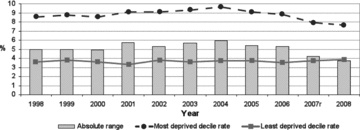
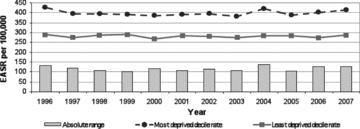
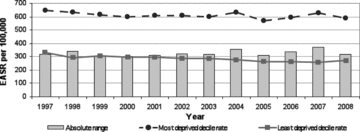
Methods: First, we constructed a set of critical appraisal criteria to assess the utility of routinely collected outcomes for monitoring socioeconomic inequalities in population health status, using epidemiological principles to measure health status and quantify health inequalities. We then selected as case studies three recent "cutting-edge" reports on health inequalities from the Scottish government and assessed the extent to which each of the following outcomes met our critical appraisal criteria: natality (low birth weight rate, LBW), adult mortality (all-cause, coronary heart disease [CHD], alcohol-related, cancer, and healthy life expectancy at birth), cancer incidence, and mental health and well-being.
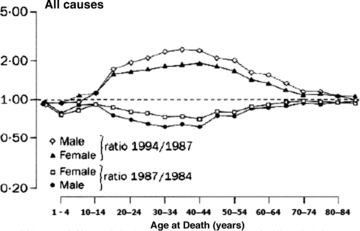
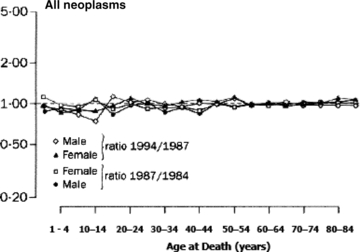
Findings: The critical appraisal criteria we derived were "completeness and accuracy of reporting"; "reversibility and sensitivity to intervention"; "avoidance of reverse causation"; and "statistical appropriateness." Of these, the most commonly unmet criterion across the routinely collected outcomes was "reversibility and sensitivity to intervention." The reasons were that most mortality events occur in later life and that the LBW rate has now become obsolete as a sole indicator of perinatal health. Other outcomes were also judged to fail other criteria, notably alcohol-related mortality after midlife ("avoidance of reverse causation"); all cancer sites' incidence and mortality (statistical appropriateness due largely to heterogeneity of SEP gradients across different cancer sites, as well as long latency); and mental health and well-being ("uncertain reversibility and sensitivity to intervention").
Conclusions: We conclude that even state-of-the-art data reports on health inequalities by SEP have only limited usefulness for most health and social policymakers because they focus on routinely collected outcomes that are not very sensitive to intervention. We argue that more "upstream" outcome measures are required, which occur earlier in the life course, can be changed within a half decade by feasible programs and policies of proven effectiveness, accurately reflect individuals' future life-course chances and health status, and are strongly patterned by SEP.
© 2011 Milbank Memorial Fund.
Figures
Comment in
-
Commentary: long-term monitoring of health inequalities in Scotland--a response to Frank and Haw.Milbank Q. 2013 Mar;91(1):186-91. doi: 10.1111/milq.12006. Milbank Q. 2013. PMID: 23488715 Free PMC article. No abstract available.
-
Commentary: persistent social inequalities in health--insensitive outcomes, inadequate policies, or both?Milbank Q. 2013 Mar;91(1):192-200. doi: 10.1111/milq.12007. Milbank Q. 2013. PMID: 23488716 Free PMC article. No abstract available.
-
Commentary: measuring what matters most.Milbank Q. 2013 Mar;91(1):201-4. doi: 10.1111/milq.12008. Milbank Q. 2013. PMID: 23488717 Free PMC article. No abstract available.
-
Commentary: best practice for what?Milbank Q. 2013 Mar;91(1):205-9. doi: 10.1111/milq.12009. Milbank Q. 2013. PMID: 23488718 Free PMC article. No abstract available.
References
-
- Barker DJP. Fetal Origins of Cardiovascular and Lung Disease. New York: Dekker; 2001.
-
- Björck L, Rosengren A, Bennett K, Lappas G, Capewell S. Modelling the Decreasing Coronary Heart Disease Mortality in Sweden between 1986 and 2002. European Heart Journal. 2009;30(9):1046–56. - PubMed
-
- Bone MR, Bebbington AC, Jagger C, Nicolaas G. Health Expectancy and Its Uses. London: HMSO; 1995.
-
- Capewell S, O'Flaherty M. What Explains Declining Coronary Mortality? Lessons and Warnings. Heart. 2008;94(9):1105–8. - PubMed
-
- Carstairs V, Morris R. Deprivation in Scotland. Aberdeen: Aberdeen University Press; 1991.
Publication types
MeSH terms
Grants and funding
LinkOut - more resources
Full Text Sources
Medical
Miscellaneous
