

A novel mean-centering method for normalizing microRNA expression from high-throughput RT-qPCR data
- PMID: 22188771
- PMCID: PMC3267743
- DOI: 10.1186/1756-0500-4-555
A novel mean-centering method for normalizing microRNA expression from high-throughput RT-qPCR data
Abstract
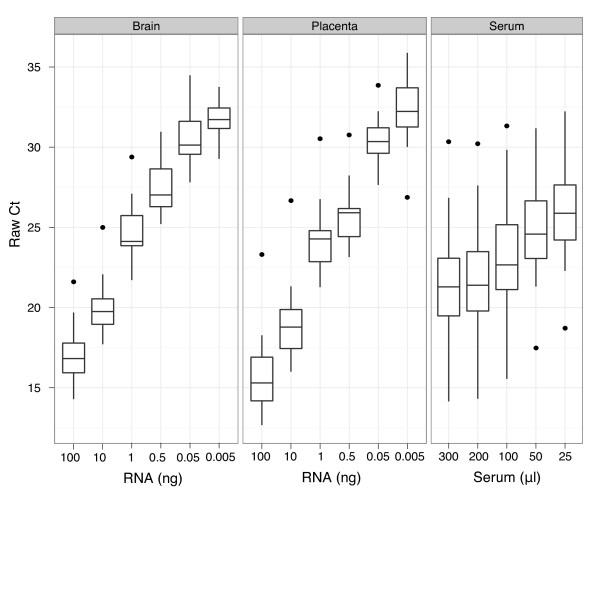
Background: Normalization is critical for accurate gene expression analysis. A significant challenge in the quantitation of gene expression from biofluids samples is the inability to quantify RNA concentration prior to analysis, underscoring the need for robust normalization tools for this sample type. In this investigation, we evaluated various methods of normalization to determine the optimal approach for quantifying microRNA (miRNA) expression from biofluids and tissue samples when using the TaqMan® Megaplex™ high-throughput RT-qPCR platform with low RNA inputs.
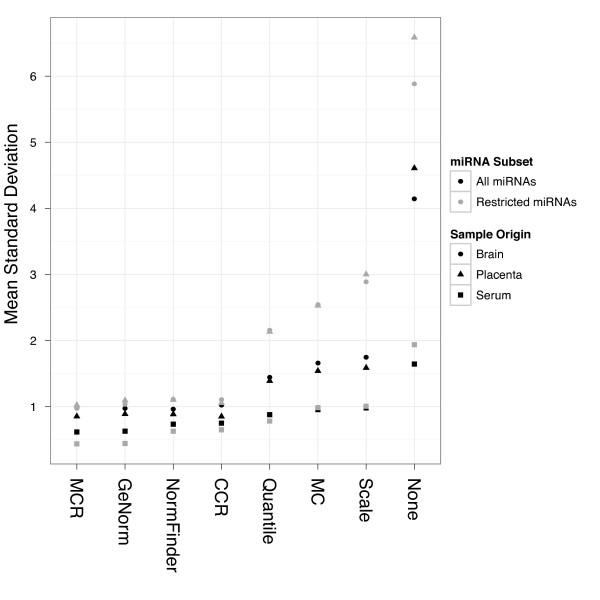
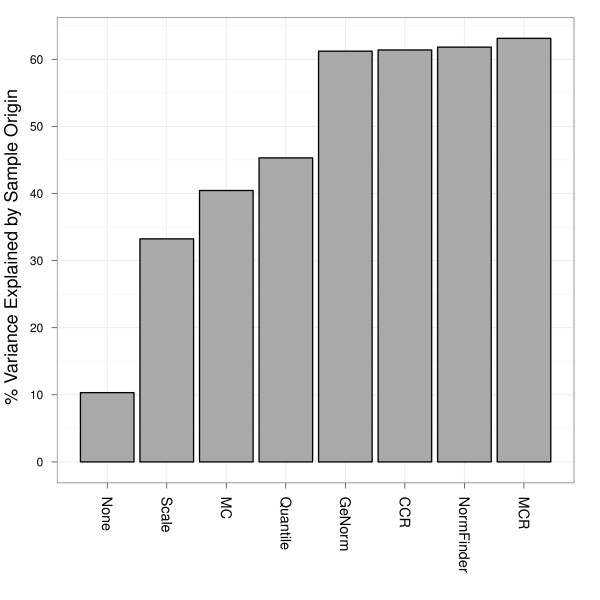
Findings: We compared seven normalization methods in the analysis of variation of miRNA expression from biofluid and tissue samples. We developed a novel variant of the common mean-centering normalization strategy, herein referred to as mean-centering restricted (MCR) normalization, which is adapted to the TaqMan Megaplex RT-qPCR platform, but is likely applicable to other high-throughput RT-qPCR-based platforms. Our results indicate that MCR normalization performs comparable to or better than both standard mean-centering and other normalization methods. We also propose an extension of this method to be used when migrating biomarker signatures from Megaplex to singleplex RT-qPCR platforms, based on the identification of a small number of normalizer miRNAs that closely track the mean of expressed miRNAs.
Conclusions: We developed the MCR method for normalizing miRNA expression from biofluids samples when using the TaqMan Megaplex RT-qPCR platform. Our results suggest that normalization based on the mean of all fully observed (fully detected) miRNAs minimizes technical variance in normalized expression values, and that a small number of normalizer miRNAs can be selected when migrating from Megaplex to singleplex assays. In our study, we find that normalization methods that focus on a restricted set of miRNAs tend to perform better than methods that focus on all miRNAs, including those with non-determined (missing) values. This methodology will likely be most relevant for studies in which a significant number of miRNAs are not detected.
Figures
References
-
- Cortez MA, Ivan C, Zhou P, Wu X, Ivan M, Calin GA. microRNAs in cancer: from bench to bedside. Adv Cancer Res. 2010;108:113–157. - PubMed
LinkOut - more resources
Full Text Sources
Other Literature Sources
