. 2011 Dec 21:8:178.
doi: 10.1186/1742-2094-8-178.

TLR3 signaling is either protective or pathogenic for the development of Theiler's virus-induced demyelinating disease depending on the time of viral infection

Affiliations

TLR3 signaling is either protective or pathogenic for the development of Theiler's virus-induced demyelinating disease depending on the time of viral infection

Young-Hee Jin et al. J Neuroinflammation. .

Abstract

Background: We have previously shown that toll-like receptor 3 (TLR3)-mediated signaling plays an important role in the induction of innate cytokine responses to Theiler's murine encephalomyelitis virus (TMEV) infection. In addition, cytokine levels produced after TMEV infection are significantly higher in the glial cells of susceptible SJL mice compared to those of resistant C57BL/6 mice. However, it is not known whether TLR3-mediated signaling plays a protective or pathogenic role in the development of demyelinating disease.

Methods: SJL/J and B6;129S-Tlr3tm1Flv/J (TLR3KO-B6) mice, and TLR3KO-SJL mice that TLR3KO-B6 mice were backcrossed to SJL/J mice for 6 generations were infected with Theiler's murine encephalomyelitis virus (2 × 10⁵ PFU) with or without treatment with 50 μg of poly IC. Cytokine production and immune responses in the CNS and periphery of infected mice were analyzed.

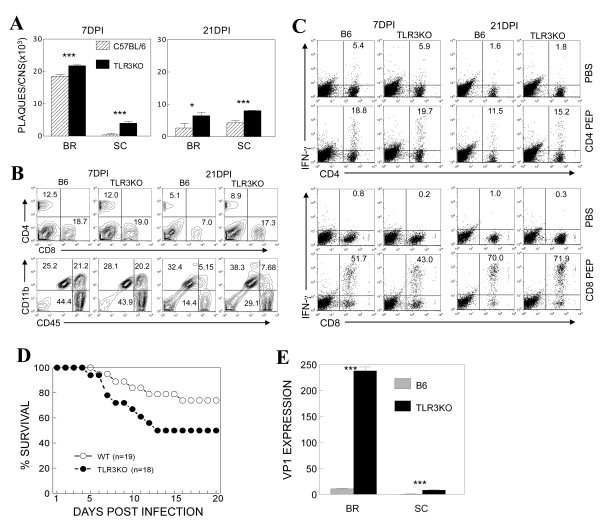
Results: We investigated the role of TLR3-mediated signaling in the protection and pathogenesis of TMEV-induced demyelinating disease. TLR3KO-B6 mice did not develop demyelinating disease although they displayed elevated viral loads in the CNS. However, TLR3KO-SJL mice displayed increased viral loads and cellular infiltration in the CNS, accompanied by exacerbated development of demyelinating disease, compared to the normal littermate mice. Late, but not early, anti-viral CD4+ and CD8+ T cell responses in the CNS were compromised in TLR3KO-SJL mice. However, activation of TLR3 with poly IC prior to viral infection also exacerbated disease development, whereas such activation after viral infection restrained disease development. Activation of TLR3 signaling prior to viral infection hindered the induction of protective IFN-γ-producing CD4+ and CD8+ T cell populations. In contrast, activation of these signals after viral infection improved the induction of IFN-γ-producing CD4+ and CD8+ T cells. In addition, poly IC-pretreated mice displayed elevated PDL-1 and regulatory FoxP3+ CD4+ T cells in the CNS, while poly IC-post-treated mice expressed reduced levels of PDL-1 and FoxP3+ CD4+ T cells.

Conclusions: These results suggest that TLR3-mediated signaling during viral infection protects against demyelinating disease by reducing the viral load and modulating immune responses. In contrast, premature activation of TLR3 signal transduction prior to viral infection leads to pathogenesis via over-activation of the pathogenic immune response.


Figures

Figure 1
Figure 1
Decreased TMEV clearance in the CNS of TLR3 KO mice. (A) The level of infectious TMEV in the whole brain (BR) and spinal cord (SC) from wild type and TLR3 KO mice at 7 and 21 days postinfection (1 × 10⁶ PFU) was determined by plaque assays in BHK cells. (P < 0.05 at all time points based on the paired Student's t test). Data represent values from a representative experiment from three independent experiments conducted with CNS pools of three mice per group. The values given are means ± standard deviations of triplicates. Statistically significant differences were indicated with asterisks (*, P < 0.05; ***, P < 0.001). (B) CNS-infiltrating mononuclear cells from TMEV-infected wild type and TLR3 KO mice at 7 and 21 dpi. Numbers in FACS plots represent percentages in the CNS. Data are representative of three experiments using three mice per group. (C) Levels of IFN-γ producing CD4+ and CD8+ cells in the CNS were determined by intracellular staining after stimulation for 6 hr with 2 μM CD4 or CD8 viral epitope peptides. Numbers in the FACS plots represent % of IFN-γ producing CD4+ or CD8+ cells from total infiltrating CD4+ or CD8+ cells. The data represent three separate experiments using three mice per group. (D) Survival rate of wild type and TLR3KO mice after intraperitoneal infection with GDVII was monitored for 20 days. (E) Viral persistence levels in the brain (BR) and spinal cord (SC) of infected mice at 7 dpi (DPI) were determined by quantitative PCR. Data are expressed by fold induction after normalization to GAPDH mRNA levels. The values given are means ± standard deviations of triplicates. Statistically significant differences were indicated with asterisks (***, P < 0.001)
Figure 2
Figure 2
The course of TMEV-induced demyelinating disease development and viral persistence levels in NLM and TLR3KO-SJL mice. (A) Frequency and severity of demyelinating disease in NLM (n = 10) and TLR3KO-SJL (n = 10) were monitored for 80 days after TMEV infection. (B) Viral persistence levels in the brain (BR) and spinal cord (SC) of infected mice at 7, 21 and 50 dpi (DPI) were determined by plaque assay. Data represent values from a representative experiment from three independent experiments conducted with CNS pools of three mice per group. Statistically significant differences were indicated with asterisks (**, P < 0.01; ***, P < 0.001).
Figure 3
Figure 3
Histopathology of TMEV-infected NLM and TLR3KO-SJL mice. (A) Hematoxylin-eosin (HE) staining (a, d), Kluver-Barrera (KB) staining (b, e) and immunohistochemical staining for GFAP, astrocyte marker (c, f) of spinal cord from NLM or TLR3KO-SJL mice were done at 27 dpi (DPI). Original magnification, 100×. (B) Immunohistochemical staining for CD3 (a, d, g, and j), CD45R, a marker of B cell (b, e, h, and k), and F4/80, a marker of macrophage (c, f, i, and l) of the spinal cord from NLM or TLR3KO-SJL mice were done at days 10 and 27 post infection. Original magnification, 400×.
Figure 4
Figure 4
CNS-infiltrating mononuclear cells from TMEV-infected NLM and TLR3KO-SJL mice. (A) Overall numbers of CNS-infiltrating mononuclear cells in the CNS of TMEV-infected NLM and TLR3KO-SJL at 7, 21, and 80 DPI were shown. The values given are means ± standard deviations of 2-3 independent experiments derived from pooled cells of 3-4 mice per group. (B) Levels of T cells (CD4+ and CD8+), macrophages (CD11b+ CD45high) and granulocytes (Ly6G/6C+ and CD45+) were assessed using flow cytometry. Numbers in the FACS plots represent percentages in the CNS of TMEV-infected NLM and TLR3KO-SJL at 7 and 21 dpi. (C) Cytokine mRNA expression levels in the CNS of NLM and TLR3KO-SJL at 7 and 21 dpi were analyzed by quantitative PCR. Data are expressed by fold induction after normalization to the GAPDH mRNA levels. The values given are means ± standard deviations of triplicates. Statistically significant differences were indicated with asterisks (*, P < 0.05; **, P < 0.01; ***, P < 0.001). A representative result of three separate experiments using three mice per group was shown here.
Figure 5
Figure 5
CD4+ and CD8+ T cell responses to viral epitopes in TMEV-infected NLM and TLR3KO-SJL mice. (A) Proportions of IFN-γ-producing CD4+ cells in the CNS were determined by intracellular staining after stimulation with 2 μM of SJL CD4 capsid (SJL SP) or SJL CD4 noncapsid (SJL NSP) epitope mixtures. Numbers in the FACS plots represent % of IFN-γ producing CD4+ cells from total infiltrating CD4+ cells. (C) IFN-γ-producing CD4+ cell numbers in the CNS at 7 and 21 dpi were shown after stimulation with SJL CD4 capsid (SJL SP) (left panel) or SJL CD4 noncapsid (SJL NSP) (right panel) epitope mixtures. (B) Proportions of IFN-γ-producing CD8+ cells in the CNS were determined by intracellular staining after stimulation with 2 μM of SJL CD8 epitope mixture. Numbers in the FACS plots represent % of IFN-γ producing CD8+ cells from total infiltrating CD8+ cells. Numbers in the bottom panel represent % of H-2Ks-VP3159-166 tetramer-positive CD8+ cells from total infiltrating CD8+ cells without further stimulation. (D) IFN-γ-producing CD8+ cell numbers after stimulation with SJL CD8 epitopes (left panel) and total numbers of H-2Ks-VP3159-166 tetramer-reactive CD8+ cells in the CNS at 7 and 21 dpi were shown (right panel). (E) The relative expression levels of IFN-γ vs. IL-17 mRNAs in the CNS of virus-infected TLR3KO-SJL and NLM were assessed by real-time PCR. Data are expressed by fold induction after normalization to the GAPDH mRNA levels. The values given are means ± standard deviations of triplicates. Statistically significant differences were indicated with asterisks (*, P < 0.05; **, P < 0.01; ***, P < 0.001). (F) Expression of CD69, activation marker of CD4 and CD8 from TMEV-infected NLM and TLR3KO-SJL mice at 7 DPI was analyzed by FACS. Numbers in cytometric plots represent % of positive CD4+ or CD8+ T cells out of the total CD4+ or CD8+ T cells, respectively. (G) Expression levels of MHC class I (H-2Ks) and II (I-As) molecules on microglia (MG) and macrophages (MP) of TMEV-infected NLM and TLR3KO-SJL mice were analyzed at 7 dpi by flow cytometry. Numbers in cytometric plots represent % of positive MG or MP out of the total MG or MP, respectively.
Figure 6
Figure 6
Administration of poly IC at 1 day prior to or 8 days post TMEV infection into SJL mice. Mice were intraperitoneally injected with either PBS or 50 μg of poly IC (Sigma) in 100 μl at day -1 or +8 relative to viral infection. (A) Frequency and severity of demyelinating disease in SJL mice after ip injection with poly IC at 1 day prior to (n = 10) or 8 days post (n = 10) TMEV infection were monitored for 63 days after TMEV infection. Statistically significant differences in Student's t-test were indicated with asterisks (*, P < 0.05). Paired t-tests (two-tailed) between 20-63 dpi indicated that the difference between untreated and pretreated groups was very significant (P < 0.0026) and the difference between untreated and post-treated groups was significant (P < 0.0189). (B) Viral persistence levels in the brain (BR) and spinal cord (SC) of infected mice at 14 dpi were determined using quantitative PCR. Data are expressed by fold induction after normalization to the GAPDH mRNA levels. The values given are means ± standard deviations of triplicates. Statistically significant differences were indicated with asterisks (*, P < 0.05; **, P < 0.01; ***, P < 0.001). (C and D) CNS-infiltrating mononuclear cells from SJL mice with treatment of poly IC at -1 day or +8 days post TMEV infection were shown. Numbers in FACS plots represent percentages in the total CNS-infiltrating cells. Data are representative of three experiments using three mice per group. (E) Levels of IFN-γ producing CD4+ cells in the CNS were determined by intracellular staining after stimulation for 6 hours with 2 μM CD4 epitope peptides at 28 dpi. (F) Levels of IFN-γ producing CD8+ cells in the CNS were determined by intracellular staining after stimulation for 6 hours with 2 μM CD8 viral epitope peptides at 28 dpi. Numbers in the FACS plots represent percentages in total CD4 or CD8 cells. Data are representative of three experiments using three mice per group.
Figure 7
Figure 7
Expressions of CD69, MHC molecules, CD40, PDL-1, and Foxp3 on CNS cells. Expressions of CD69 and FoxP3 molecules on T cells, and MHC, CD40 and PDL-1 molecules on CD11b+ cells in the CNS of mice were determined at 14 and 28 dpi by flow cytometry. (A) Expression of the CD69 activation marker on CD4+ and CD8+ T cells. (B) Expression of MHC class I (H-2Ks) and II (I-As) on CD11b+ cells (microglia and macrophages). Numbers in the FACS plots represent Mean Fluorescence Intensity. Expressions of CD40 (C) and PDL-1 (D) on CNS CD11b+ cells are shown. Numbers in the FACS plots represent percentages in total CD11b+ cells. (E) Expression of Foxp3 on CD4+ cells. Numbers in FACS plots represent percentages of total CD4+ cells. Data are representative of three experiments using three mice per group.

Similar articles

Cited by

References

    1. Akira S, Hoshino K, Kaisho T. The role of Toll-like receptors and MyD88 in innate immune responses. J Endotoxin Res. 2000;6:383–387. - PubMed
    1. Guillot L, Le Goffic R, Bloch S, Escriou N, Akira S, Chignard M, Si-Tahar M. Involvement of toll-like receptor 3 in the immune response of lung epithelial cells to double-stranded RNA and influenza A virus. J Biol Chem. 2005;280:5571–5580. - PubMed
    1. Alexopoulou L, Holt AC, Medzhitov R, Flavell RA. Recognition of double-stranded RNA and activation of NF-kappaB by Toll-like receptor 3. Nature. 2001;413:732–738. doi: 10.1038/35099560. - DOI - PubMed
    1. Kawai T, Akira S. Toll-like receptors and their crosstalk with other innate receptors in infection and immunity. Immunity. 2011;34:637–650. doi: 10.1016/j.immuni.2011.05.006. - DOI - PubMed
    1. Zhang SY, Jouanguy E, Ugolini S, Smahi A, Elain G, Romero P, Segal D, Sancho-Shimizu V, Lorenzo L, Puel A. et al.TLR3 deficiency in patients with herpes simplex encephalitis. Science. 2007;317:1522–1527. doi: 10.1126/science.1139522. - DOI - PubMed

Publication types

MeSH terms