

Quantitative ultrashort echo time (UTE) MRI of human cortical bone: correlation with porosity and biomechanical properties
- PMID: 22190232
- PMCID: PMC3463505
- DOI: 10.1002/jbmr.1535
Quantitative ultrashort echo time (UTE) MRI of human cortical bone: correlation with porosity and biomechanical properties
Abstract
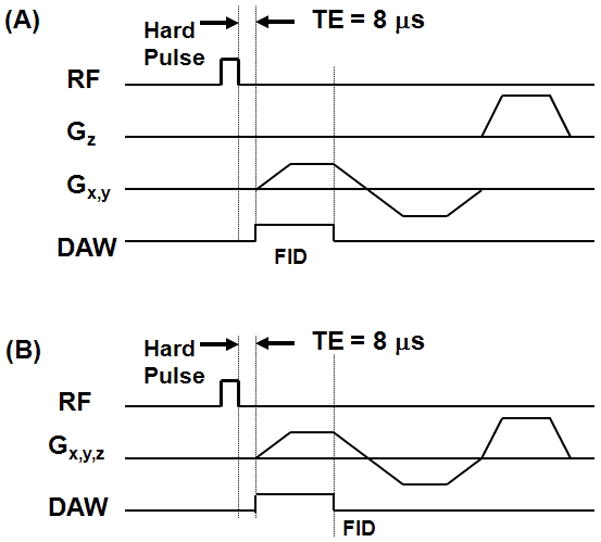
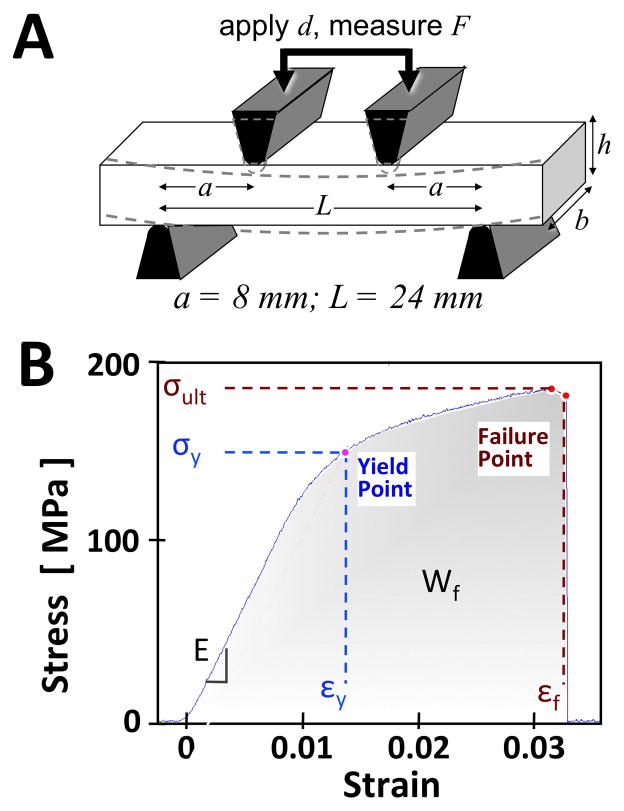
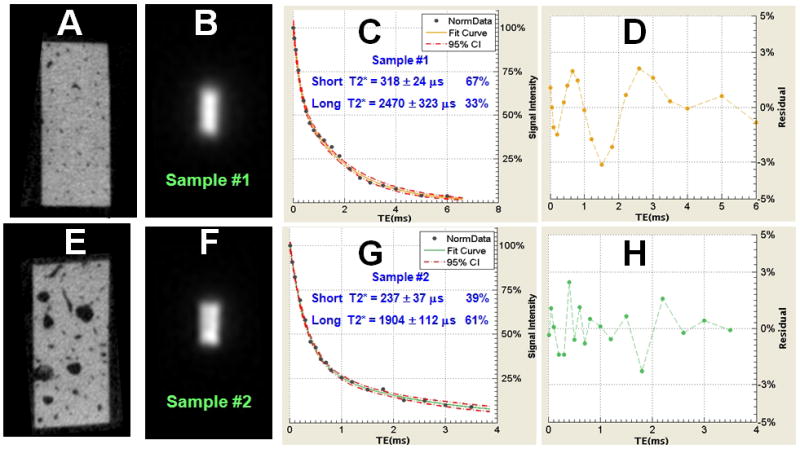
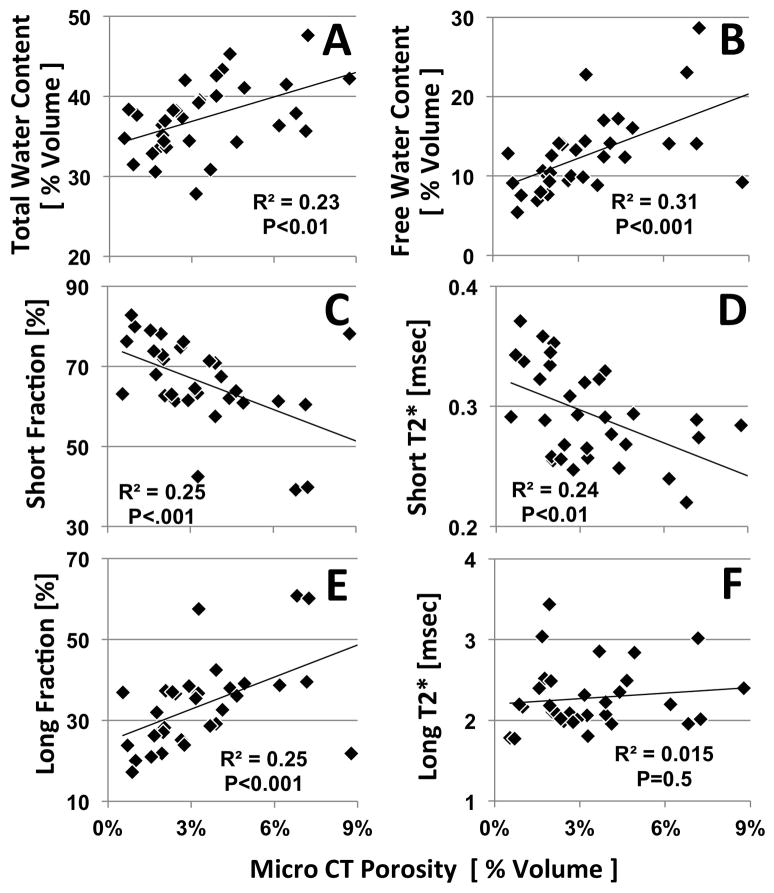
In this study we describe the use of ultrashort echo time (UTE) magnetic resonance imaging (MRI) to evaluate short and long T2* components as well as the water content of cortical bone. Fourteen human cadaveric distal femur and proximal tibia were sectioned to produce 44 rectangular slabs of cortical bone for quantitative UTE MR imaging, microcomputed tomography (µCT), and biomechanical testing. A two-dimensional (2D) UTE pulse sequence with a minimal nominal TE of 8 µseconds was used together with bicomponent analysis to quantify the bound and free water in cortical bone using a clinical 3T scanner. Total water concentration was measured using a 3D UTE sequence together with a reference water phantom. UTE MR measures of water content (total, free, and bound), T2* (short and long), and short and long T2* fractions were compared with porosity assessed with µCT, as well as elastic (modulus, yield stress, and strain) and failure (ultimate stress, failure strain, and energy) properties, using Pearson correlation. Porosity significantly correlated positively with total (R(2) = 0.23; p < 0.01) and free (R(2) = 0.31; p < 0.001) water content as well as long T2* fraction (R(2) = 0.25; p < 0.001), and negatively with short T2* fraction and short T2* (R(2) = 0.24; p < 0.01). Failure strain significantly correlated positively with short T2* (R(2) = 0.29; p < 0.001), ultimate stress significantly correlated negatively with total (R(2) = 0.25; p < 0.001) and bound (R(2) = 0.22; p < 0.01) water content, and failure energy significantly correlated positively with both short (R(2) = 0 30; p < 0.001) and long (R(2) = 0.17; p < 0.01) T2* values. These results suggest that UTE MR measures are sensitive to the structure and failure properties of human cortical bone, and may provide a novel way of evaluating cortical bone quality.
Copyright © 2012 American Society for Bone and Mineral Research.
Conflict of interest statement
All authors state that they have no conflicts of interest.
Figures

References
-
- American Society for Bone and Mineral Research ASBMR Bone Curriculum. 2004 http://depts.washington.edu/bonebio/ASBMRed/ASBMRed.html.
-
- Nevitt MC, Cummings SR. Type of fall and risk of hip and wrist fractures: the study of osteoporotic fractures. The Study of Osteoporotic Fractures Research Group. J Am Geriatr Soc. 1993;41:1226–1234. - PubMed
-
- World Health Organization. WHO Technical Report Series 843. Geneva: WHO; 1994. Assessment of fracture risk and its application to screening for postmenopausal osteoporosis. - PubMed
-
- NIH consensus development panel on osteoporosis prevention, diagnosis, and therapy. JAMA. 2001;285:785–795. - PubMed
-
- Martin RB, Ishida J. The relative effects of collagen fiber orientation, porosity, density, and mineralization on bone strength. J Biomech. 1989;22:419–426. - PubMed
Publication types
MeSH terms
Grants and funding
LinkOut - more resources
Full Text Sources
Medical
