. 2011 Dec 21;3(114):114ra128.
doi: 10.1126/scitranslmed.3003084.

Dynamics of dengue disease severity determined by the interplay between viral genetics and serotype-specific immunity

Affiliations

Dynamics of dengue disease severity determined by the interplay between viral genetics and serotype-specific immunity

Molly OhAinle et al. Sci Transl Med. .

Abstract

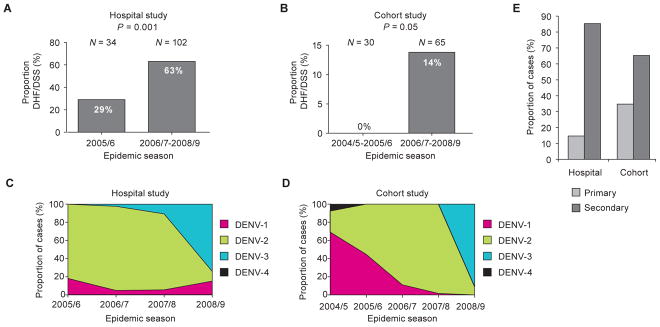
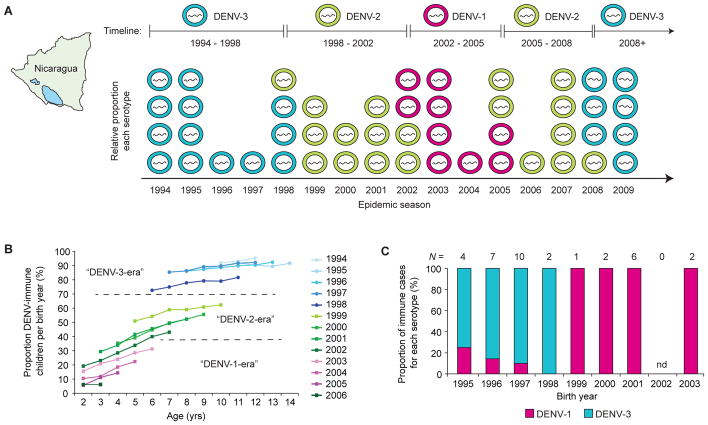
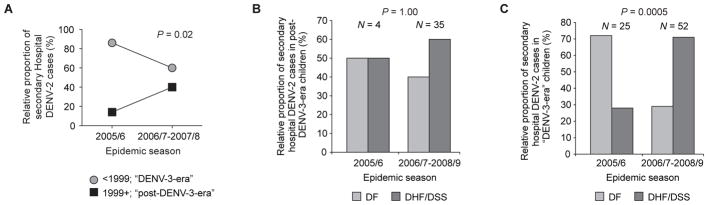
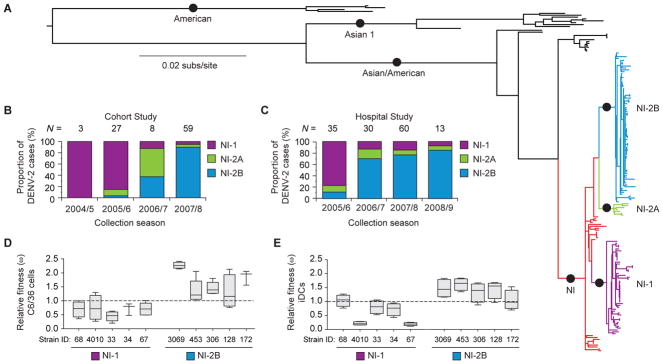
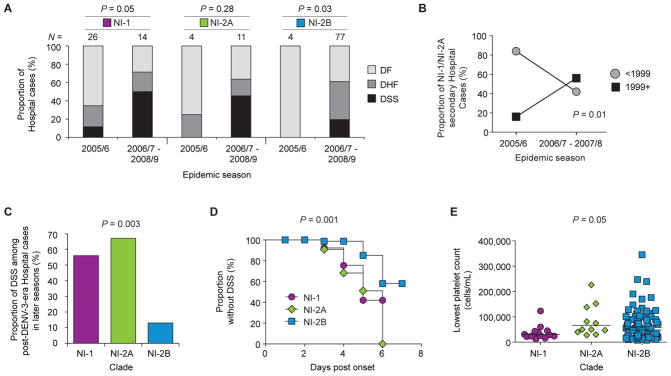
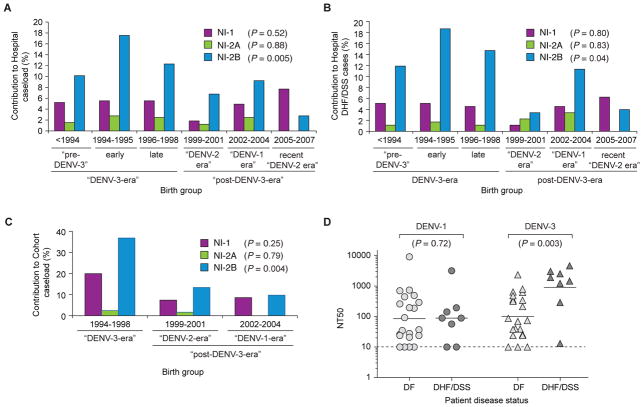
The rapid spread of dengue is a worldwide public health problem. In two clinical studies of dengue in Managua, Nicaragua, we observed an abrupt increase in disease severity across several epidemic seasons of dengue virus serotype 2 (DENV-2) transmission. Waning DENV-1 immunity appeared to increase the risk of severe disease in subsequent DENV-2 infections after a period of cross-protection. The increase in severity coincided with replacement of the Asian/American DENV-2 NI-1 clade with a new virus clade, NI-2B. In vitro analyses of viral isolates from the two clades and analysis of viremia in patient blood samples support the emergence of a fitter virus in later, relative to earlier, epidemic seasons. In addition, the NI-1 clade of viruses was more virulent specifically in children who were immune to DENV-1, whereas DENV-3 immunity was associated with more severe disease among NI-2B infections. Our data demonstrate that the complex interaction between viral genetics and population dynamics of serotype-specific immunity contributes to the risk of severe dengue disease. Furthermore, this work provides insights into viral evolution and the interaction between viral and immunological determinants of viral fitness and virulence.


Conflict of interest statement

Competing Interests: The authors declare no competing financial or other conflicts of interest.

Figures

Fig. 1
Fig. 1. Increase in severity of DENV-2 infections in two independent studies of pediatric dengue in Nicaragua
(A, B) The proportion of DENV-2 cases, including both primary and secondary infections, classified as DHF/DSS in the early as compared to later seasons in the Hospital (P = 0.001, Fisher’s exact test) (A) and Cohort (P = 0.05, Fisher’s exact test) (B) studies. The total number (N) of DENV-2 infections included in the analysis is shown above each graph. (C, D) The proportion of each serotype across four epidemic seasons (2005/6–2008/9) in the Nicaraguan Hospital study (C) and five epidemic seasons (2004/5–2008/9) in the Nicaraguan Pediatric Dengue Cohort study (D). Pink = DENV-1; green = DENV-2; blue = DENV-3; black = DENV-4. (E) The proportion of all DENV-2 cases classified as primary (light gray bars) or secondary (dark gray bars) DENV infections in the Hospital and Cohort studies, as defined in Materials and Methods.
Fig. 2
Fig. 2. DENV serotype exposure across seasons in Nicaragua
(A) The relative circulation of DENV serotypes (DENV-1 in pink; DENV-2 in green; DENV-3 in blue) by year in Nicaragua from 1994 to 2009 as derived from various DENV epidemiological studies across these years (, –69). (B) The proportion of children from the Cohort study who were immune to DENV plotted as a function of birth year. Immunity was measured annually by Inhibition ELISA in samples collected prior to each epidemic season. The dotted lines separate “DENV-3-era” (born before 1999; blue), “DENV-2-era” (born between 1999 and 2002; green) and “DENV-1-era” (born between 2003 and 2006; pink) children as analyzed in our study. Birth year color codes correspond to dominant sertoype as defined in panel A and are shown to the right of the graph. (C) Proportion of patients in the Cohort study in each birth year immune to DENV-1 (pink) or DENV-3 (blue) as determined by assaying neutralizing antibody titers (NT50 determined using RVP assay) to DENV-1 and DENV-3; N is the total number of samples analyzed from each year; the number of samples assayed in each year that did not generate significant titers for either DENV-1 or DENV-3 were 1/5 (1995), 1/8 (1996), 0/10 (1997), 3/5 (1998), 0/1 (1999), 1/3 (2000), 2/8 (2001), 0/2 (2003); nd, not determined.
Fig. 3
Fig. 3. Higher frequency of DENV-2 infection in DENV-1–immune children in later (2006/7–2008/9), versus earlier (2005/6) seasons
(A) Relative proportion of secondary DENV-2 cases in the Hospital study that occurred across seasons, stratified by birth group (circles, <1999, “DENV-3-era”; squares, 1999+, “post-DENV-3-era”; P = 0.02, Rao Scott chi square test, comparing the proportion of secondary DENV-2 Hospital cases from the “post-DENV-3-era” birth group (as opposed to the “DENV-3-era” birth group) in early versus later seasons, adjusting for the decreased representation of children from the older birth group in later seasons). (B) Relative proportion of secondary DENV-2 cases in “post-DENV-3-era” children (1999+) in the Hospital study classified as DF (light gray bars) or DHF/DSS (dark gray bars) (P = 1.00; Fisher’s exact test, comparing the proportion of secondary DENV-2 Hospital cases that are DHF/DSS in early versus later seasons among “post-DENV-3-era” children). (C) Relative proportion of secondary DENV-2 cases in “DENV-3-era” children (<1999) in the Hospital study classified as DF (light bars) or DHF/DSS (dark gray bars) (P = 0.0005; Fisher’s exact test, comparing the proportion of secondary DENV-2 Hospital cases that are DHF/DSS in early versus later seasons among “DENV-3-era” children).
Fig. 4
Fig. 4. Association of Nicaraguan DENV-2 clade replacement with increased viral fitness
(A) Maximum likelihood tree of 159 complete coding-region nucleotide sequences sampled from the Cohort and Hospital studies, as well as other samples collected in Nicaragua (see Materials and Methods for details) between 1999 and 2008. Twenty-five sequences representing the major genotypes of DENV-2 (American, Asian 1 and Asian/American) were used as outgroup sequences, as they were genetically distinct from the Nicaraguan sequences. Only nodes (circles) that are supported at least 60% of the time by bootstrap re-sampling (1000 replications) of the data are shown. Major Nicaraguan clades are highlighted (NI = red; NI-1 = purple; NI-2A = green; NI-2B = blue). (B, C) Changes over time in the proportion of DENV-2 cases caused by infection with major Nicaraguan clades that occurred during the specified epidemic seasons for virus isolates that were either sequenced or genotyped (B) in the Cohort study (2004/5–2007/8; N = 97) or in (C) the Hospital study (2005/6–2008/9; N = 138). (D, E) Relative fitness (ω) as determined by dual-infection assays of NI-1 isolates in competition with each NI-2B isolate as assayed in (D) mosquito cells (C6/36) and (E) human monocyte-derived immature dendritic cells (iDCs). The proportion of each isolate present in the cell supernatant at a given time-point after infection (fo) was divided by its initial proportion in the inoculum (io) to derive a relative fitness (ω) value (ω = fo/io) (72); fo = 4 days for C6/36 cells; fo = 2 days for iDCs. A relative fitness value of 1, the neutral expectation given equal fitness of viral isolates, is shown as a dotted line. Box plots show the 25th and 75th percentiles with a line indicating the median relative fitness value and error bars showing the minimum and maximum fitness values. Five NI-1 viruses were competed against 5 NI-2B viruses. Viral strain numbers used in each assay are indicated at the bottom of the graph.
Fig. 5
Fig. 5. Association of NI-1 and NI-2A infections with more severe disease outcomes in DENV-1-immune children
(A) The proportion of dengue cases across seasons by clade—NI-1, NI-2A or NI-2B—classified as DF (light gray), DHF (dark gray) or DSS (black) in the Hospital study. An increase in cases of severe dengue disease (DHF/DSS) was observed in all clades (NI-1, P = 0.05; NI-2A, P = 0.28; NI-2B, P = 0.03; Fisher’s exact test, comparing the proportion of DENV-2 Hospital cases that are DHF/DSS in early versus later seasons for each clade). (B) The proportion of cases of secondary NI-1 and NI-2A infections in the Hospital study across seasons for each birth group (circles, <1999; squares, 1999+; P = 0.01, Rao Scott chi square test, comparing the proportion of NI-1/NI-2A secondary Hospital cases from the “post-DENV-3-era” birth group in early versus later seasons, adjusting for the expected decrease in representation of children from the older birth group in later seasons). (C) The proportion of cases of secondary DENV infections from the 1999+ birth group (DENV-1-immune) in the Hospital study in seasons 2006/7–2008/9 classified as DSS for each clade (NI-1, NI-2A and NI-2B). The proportion of each clade classified as DSS is compared against the null hypothesis that all three clades are at equal proportion (P = 0.003; Fisher’s exact test, comparing the proportion of DENV-2 Hospital cases in the later seasons that are DSS, caused by NI-1 versus NI-2A versus NI-2B, among children from the “post-DENV-3-era” birth group). (D) Kaplan-Meier plot showing the time to DSS critical phase by clade among all cases of DENV-2 infection in the later seasons in the Hospital study plotted as a function of days post-onset of illness. NI-1, circles; NI-2A, diamonds; NI-2B, squares (P = 0.001; Logrank test, comparing the time to develop DSS in the later seasons, NI-1 versus NI-2A versus NI-2B, among children in the Hospital study). (E) Lowest platelet count (cells/mL) measured during illness episode from children infected with each of the DENV-2 clade viruses in the Hospital study in later seasons (2006/7–2008/9). NI-1, circles; NI-2A, diamonds; NI-2B, squares. P = 0.05; Kruskal-Wallis, comparing the lowest platelet count, NI-1 versus NI-2A versus NI-2B, among DENV-2 Hospital cases in the later seasons. Line indicates the geometric mean. For all panels, clade designations are colored as in Figure 4.
Fig. 6
Fig. 6. Association of prior DENV-3 immunity with subsequent DENV-2 NI-2B infection
(A–C) Contribution of each clade (NI-1, purple; NI-2A, green; NI-2B, blue) to (A) all dengue cases in the Hospital study, (B) cases of DHF/DSS in the Hospital study, (C) all dengue cases in the Cohort study. The observed distribution of each clade was compared to the expected distribution under the assumption that all children have equal risk of infection. Birth years were grouped into birth groups based on the history of the circulation of particular serotypes in Nicaragua (“pre”, “early” and “late” “DENV-3-era” and “post-DENV-3-era”, including “DENV-2-era”, “DENV-1-era” and “recent DENV-2 era”). Clade NI-2B is not evenly distributed among birth groups (chi square goodness of fit test with Rao Scott correction: (A) P = 0.005; (B) P = 0.04; (C) P = 0.004). (D) Titers of neutralizing antibody (NT50) against DENV-1 (circles) and DENV-3 (triangles) assayed using the RVP neutralization assay in serum samples collected prior to 2006/7 and 2007/8 DENV-2 seasons from DF (n = 21) or DHF/DSS cases (n = 8). The limit of detection of the assay (NT50 = 10) is shown with a dotted line. The solid line indicates the geometric mean. DENV-1, P = 0.72; DENV-3, P = 0.003; Wilcoxon Rank-Sum test, comparing RVP NT50 titers in DF versus DHF/DSS cases in a nested case control study within the Hospital study. For all panels, clade designations are colored as in Figure 4.

Similar articles

Cited by

References

    1. World Health Organization. Dengue Haemorrhagic Fever: Diagnosis, Treatment, Prevention and Control. 2. World Health Organization; Geneva: 1997.
    1. Halstead SB. Dengue. Lancet. 2007;370:1644–1652. - PubMed
    1. Sangkawibha N, Rojanasuphot S, Ahandrik S, Viriyapongse S, Jatanasen S, Salitul V, Phanthumachinda B, Halstead SB. Risk factors in dengue shock syndrome: a prospective epidemiologic study in Rayong, Thailand. I. The 1980 outbreak. Am J Epidemiol. 1984;120:653–669. - PubMed
    1. Thein S, Aung MM, Shwe TN, Aye M, Zaw A, Aye K, Aye KM, Aaskov J. Risk factors in dengue shock syndrome. Am J Trop Med Hyg. 1997;56:566–572. - PubMed
    1. Burke DS, Nisalak A, Johnson DE, Scott RM. A prospective study of dengue infections in Bangkok. Am J Trop Med Hyg. 1988;38:172–180. - PubMed

Associated data