. 2011 Dec 15;25(24):2594-609.
doi: 10.1101/gad.176800.111.

The transcriptional coactivator TAZ regulates mesenchymal differentiation in malignant glioma

Affiliations

The transcriptional coactivator TAZ regulates mesenchymal differentiation in malignant glioma

Krishna P L Bhat et al. Genes Dev. .

Abstract

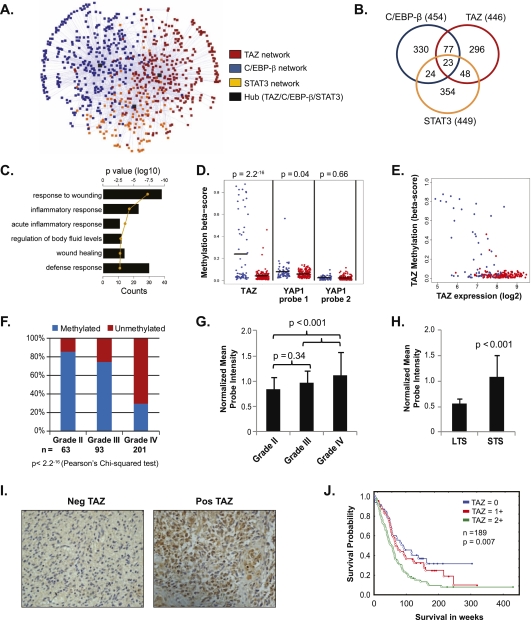
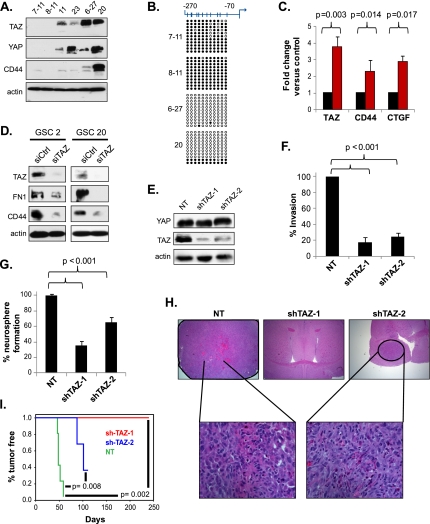
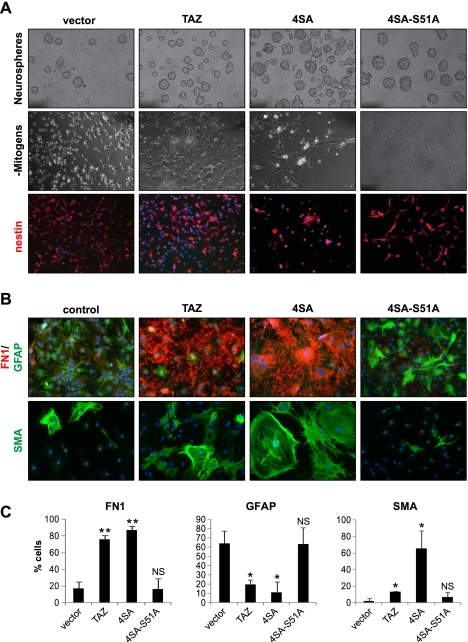
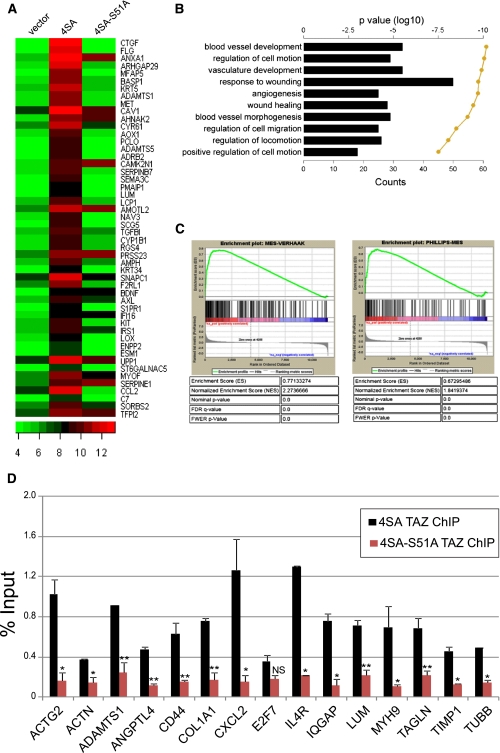
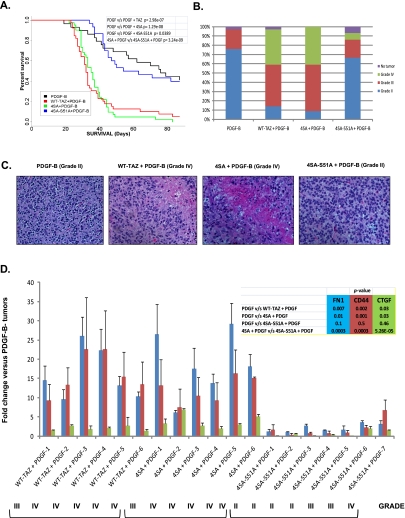
Recent molecular classification of glioblastoma (GBM) has shown that patients with a mesenchymal (MES) gene expression signature exhibit poor overall survival and treatment resistance. Using regulatory network analysis of available expression microarray data sets of GBM, including The Cancer Genome Atlas (TCGA), we identified the transcriptional coactivator with PDZ-binding motif (TAZ), to be highly associated with the MES network. TAZ expression was lower in proneural (PN) GBMs and lower-grade gliomas, which correlated with CpG island hypermethylation of the TAZ promoter compared with MES GBMs. Silencing of TAZ in MES glioma stem cells (GSCs) decreased expression of MES markers, invasion, self-renewal, and tumor formation. Conversely, overexpression of TAZ in PN GSCs as well as murine neural stem cells (NSCs) induced MES marker expression and aberrant osteoblastic and chondrocytic differentiation in a TEAD-dependent fashion. Using chromatin immunoprecipitation (ChIP), we show that TAZ is directly recruited to a majority of MES gene promoters in a complex with TEAD2. The coexpression of TAZ, but not a mutated form of TAZ that lacks TEAD binding, with platelet-derived growth factor-B (PDGF-B) resulted in high-grade tumors with MES features in a murine model of glioma. Our studies uncover a direct role for TAZ and TEAD in driving the MES differentiation of malignant glioma.


Figures

Figure 1.
Figure 1.
Association of TAZ to the MES network, the MES subclass of gliomas, and its epigenetic control. (A) Subnetwork generated from the ARACNE analysis limited to the union of Phillips and Verhaak MES target genes (n = 281). Nodes are color-coded to show the membership of a given gene to a regulatory network. (B) Venn diagram of gene overlap of the TAZ, C/EBP-β, and STAT3 networks. The number in parentheses is the total number of genes in the ARACNE network for the given TF. (C) Bar graph depicting enrichment of genes possessing MES properties in the initial ARACNE network. Functional categories showing significant enrichment based on log10 of the P-value (line) and counts (bars) are shown. (D) Methylation status of TAZ and YAP in 62 PN (blue) or 147 MES (red) GBMs from TCGA data set (Illumina Infinium platform). The black bar is the mean of the methylation β-score. Two-sample t-test between the groups was performed to assess statistical significance. (E) Correlation of TAZ expression with TAZ methylation status. Two-hundred-nine GBMs from TCGA data set with both expression data (Affymetrix platform) and methylation data (Illumina Infinium platform) are plotted. GBMs were color-coded as either MES (red) or PN (blue) based on the composite metagenes, as defined by Phillips et al. (2006) and Verhaak et al. (2010). (F) Bar graphs showing the frequency of methylation on TAZ CpG sites across various grades of glioma. Red bars indicate unmethylation and blue bars indicate methylation. Pearson's χ2 test was used to estimate significance. (G) TAZ expression in multi-institutional microarray data sets (∼800). Bar graphs indicate normalized mean probe intensity of TAZ across grades. (H) Bar graphs indicate normalized mean probe intensity of TAZ across survivors. Long-term survivors (LTS) were defined as those who lived longer than 2 years, and those who survived less than that were short-term survivors (STS). Student's t-test values are shown for significance. (I) Representative IHC images (40×) of TAZ expression. (J) Kaplan-Meier survival analysis of TAZ expression based on the IHC staining pattern. Tumors lacking TAZ expression were scored 0, and staining in the nucleus or cytoplasm was scored 1, whereas tumors showing both nuclear and cytoplasmic staining were scored 2. Log rank test values are shown.
Figure 2.
Figure 2.
TAZ is required for expression of MES markers, invasion, self-renewal, and tumor initiation in GSC20. (A) Western analyses of basal YAP, TAZ, and CD44 levels in GSCs. (B) DNA methylation analysis by bisulfite conversion followed by sequencing of cloned PCR products. (Filled circle) Methylated CG pair; (white circle) unmethylated CG pair. Each column corresponds to 11 CpG sites proximal to the transcription start site of TAZ (shown on top). Each row represents the methylation status of a clone. (C) Real-time qPCR of TAZ, CD44, and CTGF expression in GSC8–11 after treatment with 5 μM DAC for 72 h. Fold change before and after treatment was used for comparison of transcript levels and assessed using a t-test. (D) Western analysis of TAZ, FN1, and CD44 after transient knockdown of TAZ in GSC2 and GSC20. Cells were cultured in laminin and poly-L-ornithine-coated plates and transfected with siRNA for 48 h prior to immunoblotting. (E) Western analysis of stable TAZ knockdown clones showing reduction of TAZ but not YAP levels. (F) Invasion assay of TAZ stable knockdown clones in GSC20. The invasion efficiency of the nontargeting controls was set to 100% for comparison. P-values were generated using a t-test for significance. (G) Neurosphere assay of TAZ knockdown clones. Bar graphs indicate percentage of neurosphere formation, and P-values are shown for significance. (H) Representative hematoxylin and eosin-stained brain images from SCID mice injected intracranially with the TAZ stable knockdown clones. The bottom row shows higher magnification (40×) of tumors on the top row (10×). (I) Kaplan-Meier analysis of tumor-free progression for the TAZ knockdown clones compared with the nontargeting control.
Figure 3.
Figure 3.
The TAZ–TEAD interaction mediates MES transition in GSCs. (A) Western analysis of GSC11 clones overexpressing vector, 4SA, or 4SA-S51A showing Flag expression. Retrovirus encoding pBabe vector or TAZ mutants was used for transduction of GSC11. Stable clones were generated by culturing transduced cells in puromycin. (B) Immunoprecipitation of TAZ using Flag antibody followed by Western analysis of TAZ, TEAD4, and RUNX2 in 4SA- and 4SA-S51A-expressing cells. (C) Western analyses of MES proteins in GSC11 clones expressing vector, 4SA, and 4SA-S51A. (D) Invasion assay of GSC11 clones across Matrigel-coated transwell plates. Bar graphs indicate percentage of invasion. A t-test was used to compare statistical differences. (E) GSC11 clones were subjected to EdU incorporation assay; cells were plated on laminin/poly-L-ornithine-coated chamber slides, fixed, and counterstained with DAPI; and Alexa 488-positive cells were quantified using a fluorescent microscope in 10 independent fields. Bar graphs indicate mean values. A t-test was used to assess statistical significance. (NS) Not significant. (F) Western analyses of cell cycle proteins in GSC11 clones. (G) Western analyses of MES proteins after stable knockdown of TEADs. Two independent stable knockdown pools (shTEAD-a and shTEAD-b) were generated using pGipZ lentivirus. Both clones appeared to silence TEAD2 and TEAD4 effectively. (H) Osteoblast induction of GSC11 clones. Cells were cultured in differentiation medium for 3–4 wk, fixed in 70% ethanol, stained with Alizarin Red for assessing intercellular calcium deposition, and photographed. (I) Chondrocyte induction of vector control and 4SA. Cells were grown as pellets in chondrocyte medium for 4 wk, fixed in buffered 10% formalin, and embedded in paraffin. Five-micron were slide-mounted and stained for glycosaminoglycans with Safranin O.
Figure 4.
Figure 4.
The TAZ–TEAD interaction mediates MES differentiation in murine NSCs. (A) NSCs were isolated from E14 mouse brains and transduced with vector, wild-type, or mutant TAZ, and stable pools were generated using puromycin. (Top panel) Phase-contrast images of neurospheres of corresponding NSC stable pools. (Middle panel) Phase-contrast images of NSCs after 1 d of differentiation in mitogen-free medium. (Bottom panel) Dissociated NSC clones were stained for NSC marker nestin (red), and the nuclei were stained with Hoeschst dye. Bars, 100 μm. (B) Differentiation of TAZ-overexpressing NSCs in 5% serum-containing medium. The top panel shows dual staining for GFAP (green) and FN1 (red). The bottom panel shows SMA (green) staining in these clones. Bars, 100 μm. (C) Quantification of expression of various markers in NSCs. For each experiment, FN1-, GFAP-, or SMA-positive cells were counted in 10 randomized microscopic fields. Bars indicate the mean value (±SD) for at least two to three independent experiments. A t-test was used to assess statistical significance. (*) P < 0.05; (**) P < 0.005; (NS) not significant.
Figure 5.
Figure 5.
Global MES differentiation induced by TAZ–TEAD via direct recruitment to target promoters. (A) Heat map showing ranked top 50 induced genes in 4SA-expressing GSC11 compared with control. Plots are the log2 Affymetrix expression values. (B) Bar graph showing the top 10 gene ontology (GO) terms associated with the twofold or greater 4SA-induced genes, as ranked by P-value. Shown is the number of genes that are common between the GO term's gene set and the 4SA gene set. The line is the log10 of the P-value as determined by DAVID functional analysis. (C) GSEA analysis of 4SA-mediated global gene expression. A ranked list of all of the 4SA-induced genes on the HGU133a2 microarray chip was compared against Phillips (left) or Verhaak (right) MES genes. (D) ChIP-qPCR analysis of TAZ recruitment at selected target gene promoters in GSC11 overexpressing 4SA or S51A. Bar graphs represent mean percentage of input occupancy by TAZ. A t-test was used to determine statistical significance. (*) P < 0.05; (**) P < 0.005; (NS) not significant.
Figure 6.
Figure 6.
TAZ enhances tumor grade, reduces survival, and promotes MES differentiation in the RCAS/N-tva mouse model. (A) Kaplan-Meier survival analysis of PDGF-B-, WT-TAZ+PDGF-B-, 4SA+PDGF-B-, or 4SA-S51A+PDGF-B-injected mice. (B) Stacked bar graph showing WHO glioma grades within each group. (C) Representative images of hematoxylin and eosin-stained slides of brains isolated from mice injected with PDGF-B, WT-TAZ+PDGF-B, 4SA+PDGF-B, or 4SA-S51A+PDGF-B. Note that necrosis is observed only in WT-TAZ+PDGF-B and 4SA+PDGF-B mouse tumors. (D) Real-time qPCR analyses of gene expression in RCAS mouse tumors. The gene expression value of PDGF control was normalized to 1, and the relative expression of CD44, CTGF, and FN1 is shown.

Comment in

References

    1. Alcantara Llaguno S, Chen J, Kwon CH, Jackson EL, Li Y, Burns DK, Alvarez-Buylla A, Parada LF 2009. Malignant astrocytomas originate from neural stem/progenitor cells in a somatic tumor suppressor mouse model. Cancer Cell 15: 45–56 - PMC - PubMed
    1. Anido J, Saez-Borderias A, Gonzalez-Junca A, Rodon L, Folch G, Carmona MA, Prieto-Sanchez RM, Barba I, Martinez-Saez E, Prudkin L, et al. 2010. TGF-β receptor inhibitors target the CD44(high)/Id1(high) glioma-initiating cell population in human glioblastoma. Cancer Cell 18: 655–668 - PubMed
    1. Bachoo RM, Maher EA, Ligon KL, Sharpless NE, Chan SS, You MJ, Tang Y, DeFrances J, Stover E, Weissleder R, et al. 2002. Epidermal growth factor receptor and Ink4a/Arf: Convergent mechanisms governing terminal differentiation and transformation along the neural stem cell to astrocyte axis. Cancer Cell 1: 269–277 - PubMed
    1. Basu S, Totty NF, Irwin MS, Sudol M, Downward J 2003. Akt phosphorylates the Yes-associated protein, YAP, to induce interaction with 14-3-3 and attenuation of p73-mediated apoptosis. Mol Cell 11: 11–23 - PubMed
    1. Begemann M, Fuller GN, Holland EC 2002. Genetic modeling of glioma formation in mice. Brain Pathol 12: 117–132 - PMC - PubMed

Publication types

MeSH terms