. 2012 Jan 3;109(1):22-7.
doi: 10.1073/pnas.1109202108. Epub 2011 Dec 21.

Characterization and adaptive optical correction of aberrations during in vivo imaging in the mouse cortex

Affiliations

Characterization and adaptive optical correction of aberrations during in vivo imaging in the mouse cortex

Na Ji et al. Proc Natl Acad Sci U S A. .

Abstract

The signal and resolution during in vivo imaging of the mouse brain is limited by sample-induced optical aberrations. We find that, although the optical aberrations can vary across the sample and increase in magnitude with depth, they remain stable for hours. As a result, two-photon adaptive optics can recover diffraction-limited performance to depths of 450 μm and improve imaging quality over fields of view of hundreds of microns. Adaptive optical correction yielded fivefold signal enhancement for small neuronal structures and a threefold increase in axial resolution. The corrections allowed us to detect smaller neuronal structures at greater contrast and also improve the signal-to-noise ratio during functional Ca(2+) imaging in single neurons.


Conflict of interest statement

The authors declare no conflict of interest.

Figures

Fig. 1.
Fig. 1.
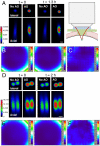
AO improves imaging quality in vivo: (A) schematic of the geometry for in vivo imaging in the mouse brain, showing the cranial window (green) embedded in the skull (pink) to provide stability to the brain as well as optical access. (B) Lateral and axial images of a 2-μm-diameter bead 170 μm below the brain surface before and after AO correction. (C) Axial signal profiles along the white line in B before and after AO correction. (D) Lateral and axial images of GFP-expressing dendritic processes over a field centered on the bead in A. (E) Axial signal profiles along the white line in D. (F) Measured aberrated wavefront in units of excitation wavelength. (G) Lateral and axial images of GFP-expressing neurons 110 μm below the surface of the brain with and without AO correction. (H) Axial signal profiles along the white line in G. (I) Axial signal profiles along the blue line in G. (J) Aberrated wavefront measured in units of excitation wavelength. (Scale bars: 2 μm in B and 10 μm elsewhere.)
Fig. 2.
Fig. 2.
Brain-induced aberrations are temporally stable over hours: (A) Lateral and axial images of a 2-μm-diameter bead 60 μm below the surface of the brain before and after AO correction, measured 1.3 h apart. (B) Aberrated wavefronts measured at the two times in A, in units of excitation wavelength. (C) Difference between the aberrated wavefronts in B, in units of excitation wavelength (note the smaller magnitude scale than in B). (D) Lateral and axial images of a pair of 2-μm beads 90 μm below the surface of the brain before and after AO correction, measured 2 h apart. (E) Aberrated wavefronts measured at the two times in D, in units of excitation wavelength. (F) Difference between the aberrated wavefronts in E, in units of excitation wavelength (note the smaller magnitude scale than in E). (Scale bar: 2 μm.)
Fig. 3.
Fig. 3.
Brain-induced aberrations increase with imaging depth: (A) The axial FWHMs of images of 2-μm-diameter beads at various depths down to 400 μm below the surface of brain, as measured without AO correction (red), with AO correction for the cranial window alone (blue), and with full AO correction for both the cranial window and the brain (black). The colored lines serve as guides to the eye, with the gray line denoting the diffraction-limited axial FWHM. (B) The rms magnitude of the brain-induced aberrated wavefront versus imaging depth, in units of excitation wavelength. (C) The signal from 2-μm beads under all three conditions.
Fig. 4.
Fig. 4.
Sample-induced aberrations depend highly on local tissue structure: (A) The AO correction on a 2-μm-diameter bead (red channel) at 65-μm depth improves the lateral and axial images of only nearby dendrites (green channel, white asterisk), because a neighboring capillary (red dashed circle) introduces a spatially localized aberration on the bead. (B) The AO correction on another 2-μm-diameter bead at 160-μm depth in a region of the brain without such large inhomogeneities improves imaging over a much larger volume. (C) AO correction for the cranial window alone is sufficient to recover diffraction-limited resolution at superficial depths (32 μm for the lateral images). The Inset to the right shows the axial signal profile along the orange line in C. (DF) Aberrated wavefronts measured for AC, respectively, in units of excitation wavelength. (Scale bar: 10 μm.)
Fig. 5.
Fig. 5.
AO correction improves calcium imaging in vivo. (A) Lateral and axial images of OGB-1 AM labeled neurons at 155 μm below the brain surface without AO correction. (B) Lateral and axial images of the same neurons with AO correction for the cranial window. (C) Measured aberrated wavefront in units of excitation wavelength. (D) Fluorescence signal (Upper) and its percentage change (Lower) for four cells indicated in A with and without AO correction. Gray bars denote the time periods during which black-and-white gratings drift in eight different directions at, from left to right, 0°, 45°, 90°, 135°, 180°, 225°, 270°, and 315°.

References

    1. Kerr JND, Denk W. Imaging in vivo: Watching the brain in action. Nat Rev Neurosci. 2008;9:195–205. - PubMed
    1. Schwertner M, Booth MJ, Neil MAA, Wilson T. Measurement of specimen-induced aberrations of biological samples using phase stepping interferometry. J Microsc. 2004;213:11–19. - PubMed
    1. Schwertner M, Booth MJ, Wilson T. Characterizing specimen induced aberrations for high NA adaptive optical microscopy. Opt Express. 2004;12:6540–6552. - PubMed
    1. Holtmaat A, et al. Long-term, high-resolution imaging in the mouse neocortex through a chronic cranial window. Nat Protoc. 2009;4:1128–1144. - PMC - PubMed
    1. Dombeck DA, Khabbaz AN, Collman F, Adelman TL, Tank DW. Imaging large-scale neural activity with cellular resolution in awake, mobile mice. Neuron. 2007;56:43–57. - PMC - PubMed

Publication types