

Reconciling molecular regulatory mechanisms with noise patterns of bacterial metabolic promoters in induced and repressed states
- PMID: 22190493
- PMCID: PMC3252923
- DOI: 10.1073/pnas.1110541108
Reconciling molecular regulatory mechanisms with noise patterns of bacterial metabolic promoters in induced and repressed states
Abstract
Assessing gene expression noise in order to obtain mechanistic insights requires accurate quantification of gene expression on many individual cells over a large dynamic range. We used a unique method based on 2-photon fluorescence fluctuation microscopy to measure directly, at the single cell level and with single-molecule sensitivity, the absolute concentration of fluorescent proteins produced from the two Bacillus subtilis promoters that control the switch between glycolysis and gluconeogenesis. We quantified cell-to-cell variations in GFP concentrations in reporter strains grown on glucose or malate, including very weakly transcribed genes under strong catabolite repression. Results revealed strong transcriptional bursting, particularly for the glycolytic promoter. Noise pattern parameters of the two antagonistic promoters controlling the nutrient switch were differentially affected on glycolytic and gluconeogenic carbon sources, discriminating between the different mechanisms that control their activity. Our stochastic model for the transcription events reproduced the observed noise patterns and identified the critical parameters responsible for the differences in expression profiles of the promoters. The model also resolved apparent contradictions between in vitro operator affinity and in vivo repressor activity at these promoters. Finally, our results demonstrate that negative feedback is not noise-reducing in the case of strong transcriptional bursting.
Conflict of interest statement
The authors declare no conflict of interest.
Figures
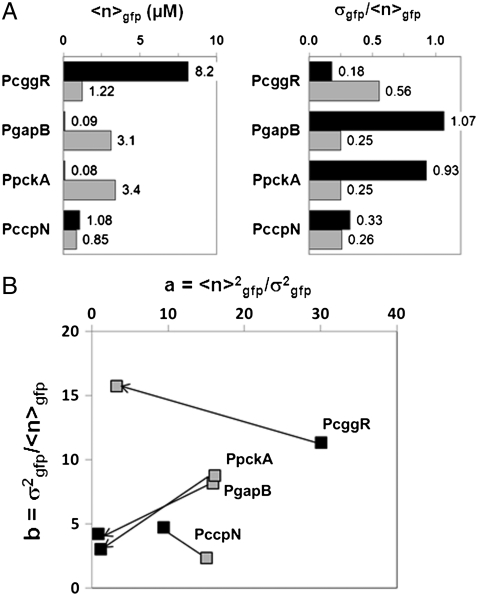
 expressed in micromolar concentration) and its coefficient of variation (the standard deviation over the mean,
  ) in the cell populations grown on glucose (black bars) or malate (gray bars), estimated from the cell-based particles number distributions shown in Fig. 2B and considering a fixed auto-fluorescence background contribution as determined in the BSB168 receiver strain under identical experimental conditions. (B) Effect of nutrient switch on promoter activity noise patterns. The parameter of stochastic gene expression, the Fano factor b
  , related to GFP production burst size is plotted against a
  related to the GFP production burst frequency for the activity of the indicated promoters on glucose (black square) or malate (gray diamonds). The single arrows indicate the sense of repression for the regulated promoters.
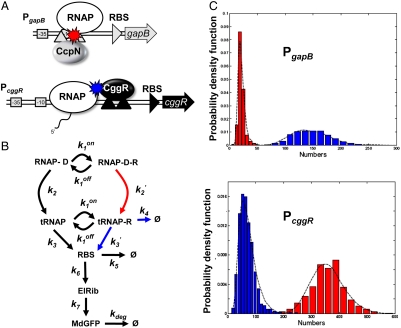
 ), CcpN repression affects primarily k2, the rate at which the elongation complex is formed, whereas CggR would affect the transcription rate in the mRNA leader region (k3), thereby increasing the dissociation rate of the (paused) polymerase (k4). In the gfpmut3 reporter system used in this study, all steps past RBS production are identical for all promoter constructs and all conditions. The GFPmut3 variant has been shown to be fast-maturing (within a few minutes) and slow degrading (stable for several hours) in B. subtilis (3), therefore the degradation rate kdeg corresponds to slow dilution whereas the lifetime of the mRNA is much shorter (i.e., k5≫kdeg). (C) Results of the model compared to the experimental data for the stochastic expression of PgapBgfp and PcggRgfp transcriptional fusions under glucose (red) or malate (blue). Lines correspond to the continuous distributions obtained from the model parameters reported in
 Similar articles
-
CcpN (YqzB), a novel regulator for CcpA-independent catabolite repression of Bacillus subtilis gluconeogenic genes.Mol Microbiol. 2005 Mar;55(5):1435-51. doi: 10.1111/j.1365-2958.2005.04473.x. Mol Microbiol. 2005. PMID: 15720552
-
Identification of ligands affecting the activity of the transcriptional repressor CcpN from Bacillus subtilis.J Mol Biol. 2008 Jun 27;380(1):17-30. doi: 10.1016/j.jmb.2008.05.002. Epub 2008 May 8. J Mol Biol. 2008. PMID: 18511073
-
Malate-mediated carbon catabolite repression in Bacillus subtilis involves the HPrK/CcpA pathway.J Bacteriol. 2011 Dec;193(24):6939-49. doi: 10.1128/JB.06197-11. Epub 2011 Oct 14. J Bacteriol. 2011. PMID: 22001508 Free PMC article.
-
Carbon catabolite control of the metabolic network in Bacillus subtilis.Biosci Biotechnol Biochem. 2009 Feb;73(2):245-59. doi: 10.1271/bbb.80479. Epub 2009 Feb 7. Biosci Biotechnol Biochem. 2009. PMID: 19202299 Review.
-
CcpA-independent carbon catabolite repression in Bacillus subtilis.J Mol Microbiol Biotechnol. 2002 May;4(3):315-21. J Mol Microbiol Biotechnol. 2002. PMID: 11931564 Review.
Cited by
-
BurstDECONV: a signal deconvolution method to uncover mechanisms of transcriptional bursting in live cells.Nucleic Acids Res. 2023 Sep 8;51(16):e88. doi: 10.1093/nar/gkad629. Nucleic Acids Res. 2023. PMID: 37522372 Free PMC article.
-
Stochasticity of metabolism and growth at the single-cell level.Nature. 2014 Oct 16;514(7522):376-9. doi: 10.1038/nature13582. Epub 2014 Sep 3. Nature. 2014. PMID: 25186725
-
Microbial metabolic noise.WIREs Mech Dis. 2021 May;13(3):e1512. doi: 10.1002/wsbm.1512. Epub 2020 Nov 23. WIREs Mech Dis. 2021. PMID: 33225608 Free PMC article. Review.
-
Cell Growth Model with Stochastic Gene Expression Helps Understand the Growth Advantage of Metabolic Exchange and Auxotrophy.mSystems. 2021 Aug 31;6(4):e0044821. doi: 10.1128/mSystems.00448-21. Epub 2021 Aug 3. mSystems. 2021. PMID: 34342540 Free PMC article.
-
Bacterial Vivisection: How Fluorescence-Based Imaging Techniques Shed a Light on the Inner Workings of Bacteria.Microbiol Mol Biol Rev. 2020 Oct 28;84(4):e00008-20. doi: 10.1128/MMBR.00008-20. Print 2020 Nov 18. Microbiol Mol Biol Rev. 2020. PMID: 33115939 Free PMC article. Review.
References
-
- Kaufmann BB, Van Oudenaarden A. Stochastic gene expression: from single molecules to the proteome. Curr Opin Genet Dev. 2007;17:107–112. - PubMed
-
- Botella E, et al. pBaSysBioII: An integrative plasmid generating gfp transcriptional fusions for high-throughput analysis of gene expression in Bacillus subtilis. Microbiology. 2010;156:1600–1608. - PubMed
-
- Cai L, Friedman N, Xie XS. Stochastic protein expression in individual cells at the single molecule level. Nature. 2006;440:358–362. - PubMed
-
- Friedman N, Cai L, Xie XS. Linking stochastic dynamics to population distribution: an analytical framework of gene expression. Phys Rev Lett. 2006;97:168302. - PubMed
Publication types
MeSH terms
Substances
LinkOut - more resources
Full Text Sources
Molecular Biology Databases
