. 2012 Jan 24;109(4):E187-96.
doi: 10.1073/pnas.1105304109. Epub 2011 Dec 21.

The c-MYC oncoprotein, the NAMPT enzyme, the SIRT1-inhibitor DBC1, and the SIRT1 deacetylase form a positive feedback loop

Affiliations

The c-MYC oncoprotein, the NAMPT enzyme, the SIRT1-inhibitor DBC1, and the SIRT1 deacetylase form a positive feedback loop

Antje Menssen et al. Proc Natl Acad Sci U S A. .

Abstract

Silent information regulator 1 (SIRT1) represents an NAD(+)-dependent deacetylase that inhibits proapoptotic factors including p53. Here we determined whether SIRT1 is downstream of the prototypic c-MYC oncogene, which is activated in the majority of tumors. Elevated expression of c-MYC in human colorectal cancer correlated with increased SIRT1 protein levels. Activation of a conditional c-MYC allele induced increased levels of SIRT1 protein, NAD(+), and nicotinamide-phosphoribosyltransferase (NAMPT) mRNA in several cell types. This increase in SIRT1 required the induction of the NAMPT gene by c-MYC. NAMPT is the rate-limiting enzyme of the NAD(+) salvage pathway and enhances SIRT1 activity by increasing the amount of NAD(+). c-MYC also contributed to SIRT1 activation by sequestering the SIRT1 inhibitor deleted in breast cancer 1 (DBC1) from the SIRT1 protein. In primary human fibroblasts previously immortalized by introduction of c-MYC, down-regulation of SIRT1 induced senescence and apoptosis. In various cell lines inactivation of SIRT1 by RNA interference, chemical inhibitors, or ectopic DBC1 enhanced c-MYC-induced apoptosis. Furthermore, SIRT1 directly bound to and deacetylated c-MYC. Enforced SIRT1 expression increased and depletion/inhibition of SIRT1 reduced c-MYC stability. Depletion/inhibition of SIRT1 correlated with reduced lysine 63-linked polyubiquitination of c-Myc, which presumably destabilizes c-MYC by supporting degradative lysine 48-linked polyubiquitination. Moreover, SIRT1 enhanced the transcriptional activity of c-MYC. Taken together, these results show that c-MYC activates SIRT1, which in turn promotes c-MYC function. Furthermore, SIRT1 suppressed cellular senescence in cells with deregulated c-MYC expression and also inhibited c-MYC-induced apoptosis. Constitutive activation of this positive feedback loop may contribute to the development and maintenance of tumors in the context of deregulated c-MYC.


Conflict of interest statement

The authors declare no conflict of interest.

Figures

Fig. 1.
Fig. 1.
c-MYC induces SIRT1 protein expression. Lysates were prepared at the indicated time points and subjected to Western blot analysis (A and DG). Detection of α-tubulin or β-actin served as loading controls. (A) RAT1 c-myc−/− (HO15) fibroblasts (82) stably expressing c-Myc-ER were starved for 48 h at 0.1% FBS and then treated with 300 nM 4-hydroxytamoxifen (4-OHT) for activation of Myc-ER. As a control, serum starvation was continued for another 48 h (right lane). (B) RAT1 c-myc−/− (HO15) fibroblasts stably expressing c-Myc-ER were starved for 48 h at 0.1% FBS and then treated with 300 nM 4-OHT for activation of c-Myc-ER. At the indicated time points mRNA expression of c-MYC target genes and SIRT1 was analyzed by quantitative PCR (qPCR) [SIRT1 primer pair 1 (p1) and 2 (p2)]. Western blot analysis of these cells is shown in A. Bars represent mean values of biological triplicates (SIRT1) or duplicates with SE. LDHa, lactate dehydrogenase A; NPM, nucleophosmin; ODC, ornithine decarboxylase. (C) qPCR analysis of SIRT1 expression and direct c-MYC target genes 11 h after c-MYC activation in P493-6 cells, a pre–B-cell line that harbors a conditional c-MYC allele (83). Bars represent mean values of biological triplicates with SE. CDK4, cyclin-dependent kinase 4; DKC, dyskerin. Five additional cell lines were analyzed with similar results after induction of a conditional c-MYC allele or after activation of endogenous c-MYC with up to two different SIRT1-specific primer pairs (SI Appendix, Fig. S1 C and D). (D) LS-174T colorectal cancer cells were treated with 1 μg/mL DOX for the indicated periods to activate the expression of c-MYC–specific shRNA (84). (E) c-myc+/+ (TGR) and c-myc−/− RAT1 fibroblasts (HO15) were kept for 48 h at 0.1% FBS and then restimulated with 8% (vol/vol) FBS for the indicated periods. (F) HDF expressing either SIRT1-GFP or GFP were serum starved at 0.1% FBS for 48 h and then restimulated with 10% (vol/vol) FBS for the indicated periods. See also SI Appendix, Fig. S1E. (G) HO15 (myc−/−) and TGR-1 (myc+/+) cells were treated with MG132 (10 μM) for the indicated periods. (H) Expression of c-MYC and SIRT1 protein in colorectal cancer and adjacent normal colonic cells. Shown are representative results obtained by immunohistochemical analysis of consecutive sections derived from one colorectal biopsy (of 15) with antibodies directed against c-MYC and SIRT1. (Magnification: 200×.) N, normal tissue; T, tumor. See also SI Appendix, Fig. S2.
Fig. 2.
Fig. 2.
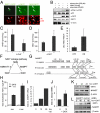
c-MYC activates SIRT1: effects on p53 and mediation by NAMPT. (A) Cells were transfected with plasmids encoding the indicated proteins and treated with etoposide (20 μM) for 7 h (HCT-116 cells; Left) or 10 Gy γ-irradiation (MCF-7 cells; Center and Right) and fixed after 4 h. Expression of ectopic MYC-HA and a c-MYC mutant with the transactivation domain replaced by the repressive Sin3 domain of MAD1 (MADMYC-HA) was detected with an anti-HA antibody (Center and Right), and SIRT1-GFP expression was detected by GFP fluorescence (Left). Acetylation (ac) of p53K382 was detected by indirect immunofluorescence. Arrows indicate the positions of cells positive for ectopic proteins (SIRT1-GFP, c-MYC-, or MADMYC-HA). (B) P493-6 c-MYC tetracycline-off cells were kept in the absence or presence of tetracycline. After 72 h cell lysates were subjected to immunoblot analysis of the indicated proteins. As documented by β-actin detection, different amounts of protein were loaded to adjust for comparable p53 levels in all samples. (C) NADH and (D) NAD+ concentrations were determined, as described previously (85), in RAT1 myc−/− fibroblasts stably expressing c-Myc-ER. After serum starvation for 48 h in 0.1% FBS, c-Myc-ER was activated for 24 h by addition of 300 nM 4-OHT. Cell lysates were subjected to the cycling reaction (for details see SI Appendix, SI Methods). The graphs show mean values ± SD of three independent experiments. Results of the individual measurements are given in SI Appendix, Table S1. (E) Mean values of NAD+/NADH ratios of MYC OFF (−4-OHT) and MYC ON (+4-OHT) are given with SDs. Data were taken from the analysis shown in C and D and SI Appendix, Table S1. (F) Schematic representation of the NAD+ salvage pathway. NAD+ is generated by NAMPT-mediated conversion of NAM to NMN, which is converted to NAD+ by the enzymes nicotinamide/nicotinic acid mononucleotide adenyltransferase (NMAT) 1–3. (G) Schematic representation of human, mouse, and rat NAMPT promoter regions. The transcription start site is indicated by “+1”, E-box positions (gray squares) and E-box motifs conserved between species are indicated. qPCR amplicon positions are indicated by pairs of arrows. (H) ChIP analysis of c-MYC binding to the NAMPT promoter in serum (ser)-stimulated MCF-7 cells. After starvation with 0.1% FBS for 48 h, half of the cells were restimulated with 10% (vol/vol) FBS for 12 h. The assay was performed in triplicate using a polyclonal anti-MYC antibody and rabbit IgGs as control. c-MYC enrichment at E-boxes was determined by qPCR with primer pairs flanking E-boxes (see G). The DNA input was normalized with a genomic amplicon devoid of E-boxes. (I) qPCR analysis of NAMPT mRNA expression upon c-MYC activation in P493-6 cells. RNA was isolated 12 and 24 h after removal of tetracycline. (J) qPCR analysis of NAMPT mRNA expression upon DOX (1 μg/mL)-mediated induction of a conditional c-MYC allele for the indicated periods in the MCF-7 cell line PJMMR1 (86). RNA samples for the 0 (noninduced) and 12-h time points were harvested simultaneously. Analyses were performed in triplicates. (K) Induction of NAMPT protein upon activation of c-MYC-ER in HDF. Cells were serum starved for 48 h and then stimulated with 4-OHT for the indicated times, lysed simultaneously, and subjected to Western blot analysis. β-actin served as loading control. (L) Induction of SIRT1 by c-Myc is dependent on NAMPT. HDF-MYC-ER cells were transfected with the indicated siRNAs and then starved as in K and treated with 4-OHT for 48 h. Cells were lysed simultaneously and analyzed by Western blotting for the expression of the indicated proteins. β-actin served as loading control.
Fig. 3.
Fig. 3.
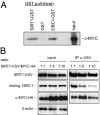
Interplay between c-MYC, DBC1, and SIRT1. (A) GST-tagged fusion proteins of DBC1 or SIRT1 and GST protein as control were used to detect interactions with in vitro transcribed and translated c-MYC. An aliquot of the c-MYC protein was analyzed as a control (input). (B) HEK-293 cells were cotransfected with a vector encoding a SIRT1-vesicular stomatitis virus (VSV) fusion protein in combination with a plasmid encoding c-MYC–HA at the indicated molar ratios. Binding of endogenous DBC1 to SIRT1-VSV was analyzed by coimmunoprecipitation and immunoblot analysis 24 h after transfection. Ectopic SIRT1 was immunoprecipitated with an antibody directed against the VSV tag.
Fig. 4.
Fig. 4.
SIRT1 and DBC1 modulate c-MYC–induced apoptosis. (A) RAT1 HO15.19 myc−/− cells expressing Myc-ER were treated with 4-OHT in the presence of 8% FBS in DMEM. NAM (5 mM) was added for 72 h before cells were harvested. Apoptotic sub-G1 cells were quantified by flow cytometric analysis of DNA content. The average of three independent experiments is depicted; bars indicate SD. (B) U2OS cells harboring pEMI and RTS vectors expressing the indicated miRNAs or proteins were treated with DOX (0.1 μg/mL). As a control, a nonsilencing miRNA or an empty RTS vector was used. After 48 h the percentage of cells in sub-G1 was determined by propidium iodide staining and FACS analysis. The mean values and SEs obtained in two independent experiments are shown. (C) As in B, pools of U2OS cells harboring DOX-inducible pEMI and RTS vectors expressing the indicated miRNAs or proteins were generated. Total cell lysates were prepared 48 h after addition of DOX (0.1 μg/mL) and subjected to Western blot analysis of the indicated proteins. As control a pEMI vector encoding a nonsilencing miRNA (miR-ctrl.) or an empty RTS vector (vector) was used. (D) As described in B, the percentage of cells in sub-G1 was determined by propidium iodide staining and FACS analysis after 72 h of DOX treatment. The mean values and SD of three samples are shown. (E) U2OS cells cotransfected with RTS or pEMI vectors encoding the indicated proteins or miRNAs (see B) were subjected to real-time impedance measurements using an x-CELLigence device (Roche). DOX (0.1 μg/mL) was added 14 or 17 h after cell seeding. This time point was used for cell index normalization. The cell index represents relative cellular impedance, which indicates relative cell numbers. Parallel end-point analysis by conventional cell counting confirmed the results shown here. (F) HDF were transfected with DBC1-specific siRNA, serum starved for 48 h, and then stimulated with 4-OHT for activation of c-MYC-ER. After 24 h cells were lysed and subjected to Western blot analysis. (Cellular impedance measurements of these cells are shown in SI Appendix, Fig. S4B.) (G) v-Myc–expressing and parental human U937 monoblasts were treated with sirtinol (30 μM) or EX527 (1 μM) for 6 d. Apoptosis was determined as enrichment of cytoplasmic nucleosomes using a quantitative cell death detection ELISA kit (Roche). (H) Effect of EX527 (1 μM) on the proliferation of MYC-transformed or (I) parental human U937 monoblasts. Cell numbers were determined at the indicated time-points.
Fig. 5.
Fig. 5.
SIRT1 suppresses apoptosis and senescence in c-MYC–immortalized HDF. (A) Expression of SIRT1 in primary (passage 16) HDF and in c-MYC (passage 77) and hTERT-immortalized HDF (passage 92) as determined by Western blot analysis. (B) Four days after transfection of primary and c-MYC–immortalized HDFs with the indicated siRNAs, cells were stained for senescence-associated β-galactosidase at pH 6 as described (87). (Right) Representative phase-contrast images of the cells before fixation. (Magnification: 200×.) (C) Effect of siRNA-mediated down-regulation of SIRT1 in HDF immortalized by c-MYC. Four days after transfection with the indicated siRNAs, the percentage of cells in sub-G1 was determined by flow cytometric analysis of DNA content. (D) Effect of inhibition of SIRT1 activity on c-MYC–immortalized HDFs. Sirtinol (50 μM), a small molecule inhibitor of SIRT1, was added to primary c-MYC–immortalized and hTERT-immortalized HDFs for 24 h. The percentage of cells in sub-G1 was determined by flow cytometric analysis of DNA content. Mean values ± SD for three independent experiments are shown.
Fig. 6.
Fig. 6.
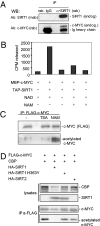
c-MYC is a SIRT1 substrate. (A) Coimmunoprecipitation of endogenous c-MYC and SIRT1. SIRT1 was immunoprecipitated from lysates of U2OS cells using a polyclonal SIRT1-specific antibody. Rabbit IgG served as control. Coprecipitated proteins were detected by Western blot analysis using the indicated antibodies. (B) Recombinant c-MYC fused to maltose-binding protein (MBP-c-MYC) was incubated with recombinant, baculovirus-expressed His-CBP and [14C]-acetyl-CoA. MBP-c-MYC was deacetylated with tandem-affinity purification-tagged SIRT1 purified from HEK-293 cells. The amount of the released acetyl ADP-ribose in the supernatant was measured by scintillation counting. As a control NAD+ was omitted or 10 mM NAM was added to the deacetylation assay as indicated. (C) HEK-293 cells were transiently transfected with a vector encoding FLAG-c-MYC and were incubated with TSA or NAM or were left untreated. Acetylation of immunoprecipitated FLAG-c-MYC was detected by Western blot analysis using a pan–acetyl-lysine–specific antibody. (D) FLAG-tagged c-MYC was coexpressed in HEK-293 cells with the indicated proteins or an empty vector. c-MYC was immunoprecipitated using a FLAG-specific antibody and was detected by immunoblot analysis using a c-MYC– or a pan–acetyl-lysine–specific antibody.
Fig. 7.
Fig. 7.
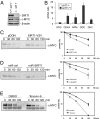
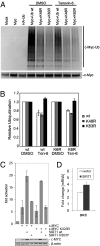
Regulation of c-MYC expression and half-life by SIRT1. (A) Exponentially proliferating, subconfluent MEFs were lysed and subjected to immunoblot analysis of the indicated proteins. (B) Exponentially proliferating, subconfluent MEFs (as in A) were analyzed by qPCR for mRNA expression of c-MYC and target genes. The mean values ± SD of biological triplicates are shown. (C) MCF-7 cells stably expressing a SIRT-VSV fusion protein (right four lanes) or the vector backbone (left four lanes) were analyzed. Cells were pulse-labeled with [35S]methionine followed by chase in medium containing cold methionine for the indicated time periods. Cell lysates were immunoprecipitated with anti-MYC antibody (N262) and subjected to SDS/PAGE followed by quantification with a phospho-imager. (D) U2OS cells harboring DOX-inducible pEMI vectors encoding a SIRT1-specific miRNA were analyzed after addition of DOX (0.1 μg/mL) for 72 h. The corresponding control sample expressed a nonsilencing miRNA pEMI vector. Pulse chase and analysis were done as in C. (E) HCT-116 cells were treated with DMSO or an SIRT1 inhibitor, tenovin-6 (10 μM) for 8 h followed by a CHX chase for the indicated time points (minutes). Cell lysates were subjected to immunoprecipitation with a polyclonal c-MYC antibody (N262). Precipitated c-MYC was determined by immunoblot analysis with the monoclonal c-MYC antibody (C33). In CE, the densitometric quantification of the remaining protein expressed as percentage of the starting amount is shown in the diagrams (Right).
Fig. 8.
Fig. 8.
SIRT1 regulates ubiquitination and activity of c-MYC. (A) HCT-116 cells were transiently transfected with wild-type c-MYC together with the indicated HA-tagged ubiquitin constructs. Forty hours after transfection, cells were treated with DMSO or the SIRT1 inhibitor tenovin-6 (10 μM) for 8 h followed by immunoprecipitation of c-MYC and immunoblot detection of HA-ubiquitin using a monoclonal HA-specific antibody (12CA5). Immunoprecipitated c-MYC was detected using a monoclonal c-MYC–specific antibody (C33). (B) Densitometric analysis of c-MYC ubiquitination. As in A, HCT-116 cells coexpressing wild-type c-MYC or the Myc-K6R were cotransfected with wild-type ubiquitin or mutant ubiquitin (K48R-Ub, K63R-Ub) constructs. The signal intensities of the blots were quantitated with a CCD camera. (C) HEK-293 cells were cotransfected with the M4–min-tk–luc reporter construct (38) with four MYC/MAX binding sites and expression plasmids encoding c-MYC, c-MYC-K323R, HA-SIRT1, and HA-SIRT1-H363Y. Mean values of three independent experiments performed in duplicate are shown. Western blot analysis of the indicated proteins detected in reporter assay lysates is shown in the lower panel. (D) qPCR analysis of the c-MYC target gene DKC 11 h after activation of a tetracycline-regulatable c-MYC allele in P493-6 B cells stably expressing pINCO-SIRT1 or the vector backbone pINCO as a control. Error bars represent SD of biological triplicates.
Fig. P1.
Fig. P1.
The c-MYC/SIRT1 feedback loop (gray) is in place in normal (green) and tumor (orange) cells. However, in normal cells, c-MYC expression is under stringent control by nutrient and growth factor availability and antimitogenic factors, which may shut off the feedback loop. In tumor and cancer cells, c-MYC expression is often constitutive and/or up-regulated as a result of alterations in the c-MYC gene or mutation of upstream regulators as components of the wnt/APC/β-catenin pathway. Therefore, the feedback loop is permanently on. p53 and X represent SIRT1-substrates with pro-cell death and prosenescence activities, which are subject to inactivation by SIRT1-mediated deacetylation. In the case of p53 this leads to reduced expression of the p53-target genes PUMA and p21, which contributes to enhanced survival and proliferation, respectively. Double colons indicate protein–protein interactions.

References

    1. Secombe J, Pierce SB, Eisenman RN. Myc: A weapon of mass destruction. Cell. 2004;117:153–156. - PubMed
    1. Dang CV, et al. The c-Myc target gene network. Semin Cancer Biol. 2006;16:253–264. - PubMed
    1. Eilers M, Eisenman RN. Myc's broad reach. Genes Dev. 2008;22:2755–2766. - PMC - PubMed
    1. Hermeking H. The MYC oncogene as a cancer drug target. Curr Cancer Drug Targets. 2003;3:163–175. - PubMed
    1. Soucek L, et al. Modelling Myc inhibition as a cancer therapy. Nature. 2008;455:679–683. - PMC - PubMed

Publication types

MeSH terms