. 2012 Feb;61(2):346-54.
doi: 10.2337/db11-0860. Epub 2011 Dec 21.

Increased macrophage migration into adipose tissue in obese mice

Affiliations

Increased macrophage migration into adipose tissue in obese mice

Da Young Oh et al. Diabetes. 2012 Feb.

Abstract

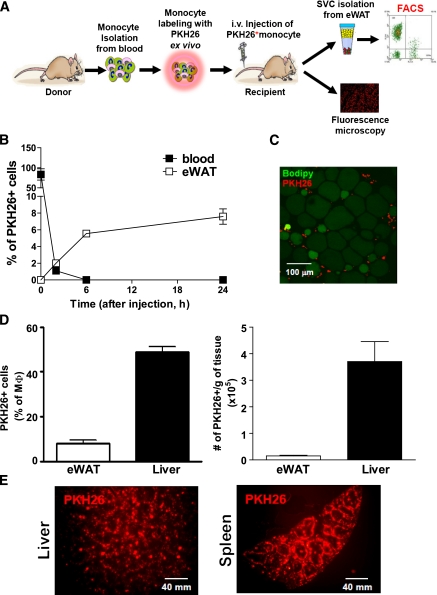
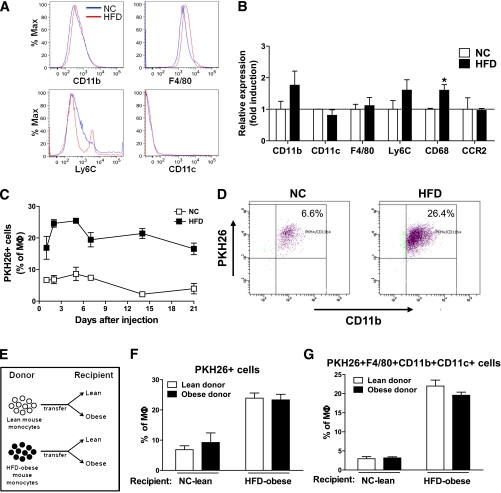
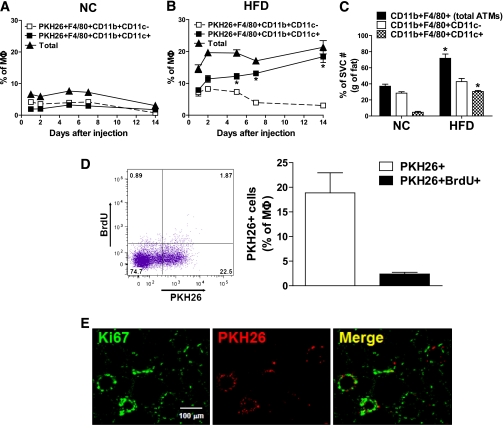
Macrophage-mediated inflammation is a key component of insulin resistance; however, the initial events of monocyte migration to become tissue macrophages remain poorly understood. We report a new method to quantitate in vivo macrophage tracking (i.e., blood monocytes from donor mice) labeled ex vivo with fluorescent PKH26 dye and injected into recipient mice. Labeled monocytes appear as adipose, liver, and splenic macrophages, peaking in 1-2 days. When CCR2 KO monocytes are injected into wild-type (WT) recipients, or WT monocytes given to MCP-1 KO recipients, adipose tissue macrophage (ATM) accumulation is reduced by ~40%, whereas hepatic macrophage content is decreased by ~80%. Using WT donor cells, ATM accumulation is several-fold greater in obese recipient mice compared with lean mice, regardless of the source of donor monocytes. After their appearance in adipose tissue, ATMs progressively polarize from the M2- to the M1-like state in obesity. In summary, the CCR2/MCP-1 system is a contributory factor to monocyte migration into adipose tissue and is the dominant signal controlling the appearance of recruited macrophages in the liver. Monocytes from obese mice are not programmed to become inflammatory ATMs but rather the increased proinflammatory ATM accumulation in obesity is in response to tissue signals.


Figures

FIG. 1.
FIG. 1.
Monocyte tracking with PKH26 fluorescent labeling. A: Schematic diagram of the monocyte-tracking strategy. B: The time course of clearance of PKH26-labeled monocytes from circulating blood (■) and appearance in eWAT (plotted as the percentage of SVF; □) from lean mice. Data are means ± SEM of three mice per each time point from two independent experiments. C: Immunohistochemistry of PKH26-labeled monocytes in adipose tissue observed by confocal microscope. Red cells are PKH26+ ATMs located around green adipocytes. The image is representative of similar results from three to four independent experiments. Scale bar represents 100 μm. D: PKH26+ cells were plotted as the percentage of the total macrophage number (left graph) in lean mice adipose tissue (eWAT) and liver and total PKH26+ cells per gram of tissue (right graph). Results are pooled data from four independent experiments. n = ~7–8. E: Immunohistochemistry analysis of liver and spleen after PKH26-labeled monocyte injection. The image is representative of similar results from three to four independent experiments. Scale bar represents 40 mm. (A high-quality digital representation of this figure is available in the online issue.)
FIG. 2.
FIG. 2.
Impaired monocyte recruitment with CCR2 monocytes and in MCP-1 KO mice. A: Blood monocytes were prepared from WT and CCR2 KO mice and then injected to HFD-fed/obese recipient mice. The number of PKH26+ cells in eWAT (B) and liver (C) were analyzed by a FACS and then plotted as the mean ± SEM from three independent experiments. n = 6 in each group. D: Monocytes were isolated from lean WT mice and, labeled with PKH26, injected into either obese WT or MCP-1 KO mice. The number of PKH26+ cells in eWAT (E) and liver (F) were analyzed by a FACS and then plotted as the mean ± SEM from three independent experiments. n = 5 in each group.
FIG. 3.
FIG. 3.
Quantitation of monocyte migration in lean and obese mice. A: Comparison of indicated monocyte markers in blood monocytes obtained from normal chow (NC)/lean and HFD-fed/obese mice. This was a representative plot for each marker from three independent experiments. n = ~5–6 in each group. B: Relative mRNA levels for indicating genes in the monocytes from an NC/lean and HFD-fed/obese mouse, as measured by quantitative PCR. Data are expressed as the mean ± SEM of three independent experiments in triplicate. *P < 0.05. n = 5 per group. C: Time course of appearance of injected monocytes as ATMs in recipient NC/lean or HFD-fed/obese recipient mice. Data present the mean ± SEM of three mice for each time point from three independent experiments. D: Two days after labeled monocyte injection into lean vs. obese mice, PKH26+ cells were calculated from total F4/80+CD11b+ ATMs by FACS analysis and then plotted with CD11b+ fluorescence. The scattergram is representative of five to six independent mice from each group. E: Donor mice were lean or obese, and labeled cells were injected into lean or obese recipients. After injection, PKH26+-labeled monocytes (F) and PKH26+F4/80+CD11b+CD11c+ cells (G) were tracked and plotted as the percentage of total macrophages in adipose tissue. The results were analyzed by a FACS and then plotted as the mean ± SEM from more than three independent experiments. n = 6 in each group.
FIG. 4.
FIG. 4.
Properties of monocyte-derived ATMs. Differentiation of injected monocytes into inflammatory ATMs was analyzed as CD11c+ vs. CD11c ATMs in NC/lean (A) and HFD-fed/obese (B) mice at the indicated times and then plotted as the mean ± SEM from three independent experiments. n = ~8–9 in each group. C: The increase in triply positive cells accounts for the majority of the increase in total ATMs. The numbers of cells of total ATMs (CD11b+F4/80+), doubly positive (F4/80+CD11b+CD11c-), and triply positive (F4/80+CD11b+CD11c+) cells were calculated from FACS data and SVF cell counts and expressed per gram of eWAT. n = 6 per group. *P < 0.05 vs. NC. Data are means ± SEM. D: To detect proliferation of PKH26-labeled monocytes, the proliferation marker BrdU was injected twice at 24 and 3 h before the end point experiment at day 7 after PKH26+ cell injection. PKH26+ and PKH26+ BrdU+ ATMs were analyzed by a FACS (left) and then plotted as the mean ± SEM from three independent experiments (right). n = 6. The scattergram is representative of five to six independent mice. E: Immunohistochemistry analyses of the proliferation marker, Ki67, to detect proliferation of PKH26+ ATMs in adipose tissue. The image is representative of similar results from three to four independent experiments. Scale bar represents 100 μm. (A high-quality digital representation of this figure is available in the online issue.)

References

    1. Olefsky JM, Courtney CH. Type 2 diabetes mellitus: etiology, pathogenesis, and natural history. In DeGroot Textbook of Endocrinology. 5th ed. Philadelphia, W.B. Saunders and Company, 2005, p. 1093–1117
    1. Reaven GM. The insulin resistance syndrome: definition and dietary approaches to treatment. Annu Rev Nutr 2005;25:391–406 - PubMed
    1. Després JP, Lemieux I. Abdominal obesity and metabolic syndrome. Nature 2006;444:881–887 - PubMed
    1. Haffner S, Taegtmeyer H. Epidemic obesity and the metabolic syndrome. Circulation 2003;108:1541–1545 - PubMed
    1. Ford ES, Williamson DF, Liu S. Weight change and diabetes incidence: findings from a national cohort of US adults. Am J Epidemiol 1997;146:214–222 - PubMed

Publication types