. 2012 Feb;61(2):364-71.
doi: 10.2337/db11-1019. Epub 2011 Dec 21.

Short-chain fatty acids stimulate glucagon-like peptide-1 secretion via the G-protein-coupled receptor FFAR2

Affiliations

Short-chain fatty acids stimulate glucagon-like peptide-1 secretion via the G-protein-coupled receptor FFAR2

Gwen Tolhurst et al. Diabetes. 2012 Feb.

Abstract

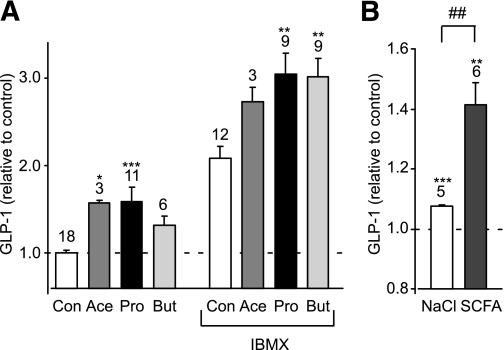
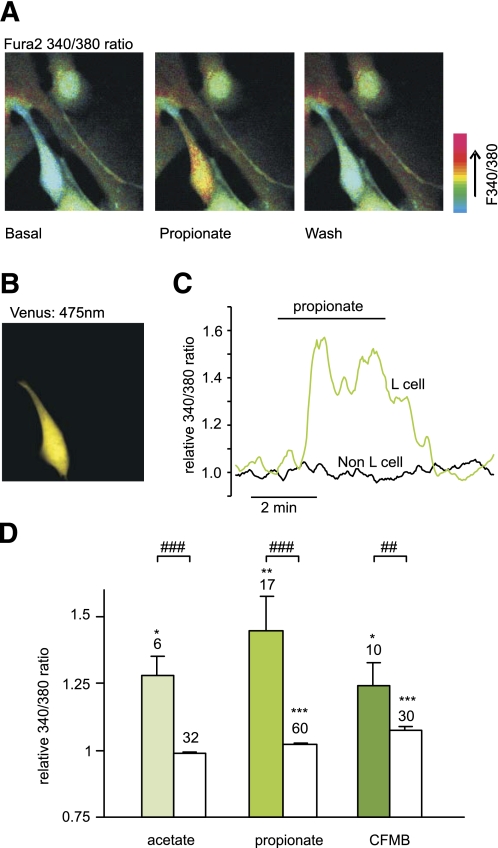
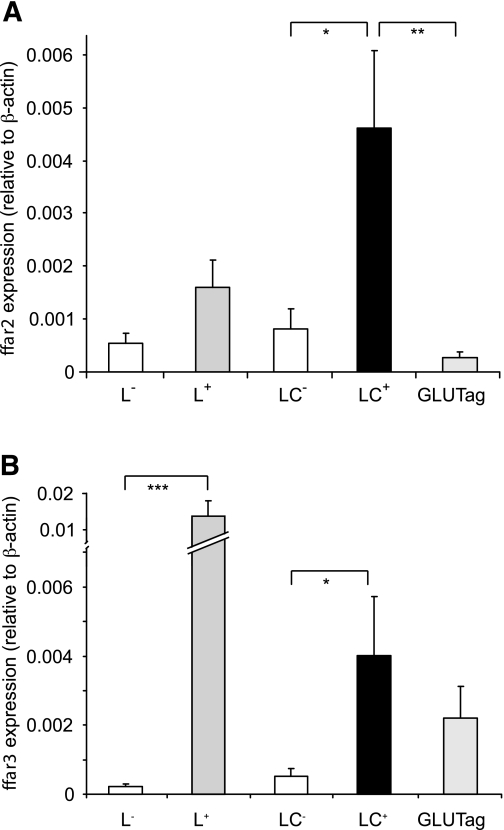
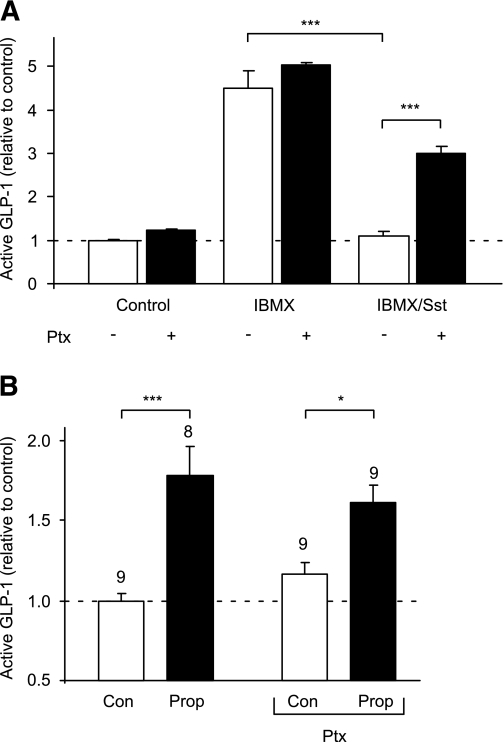
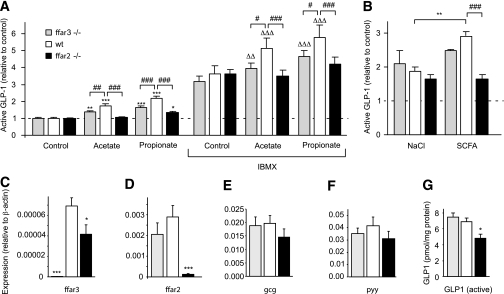
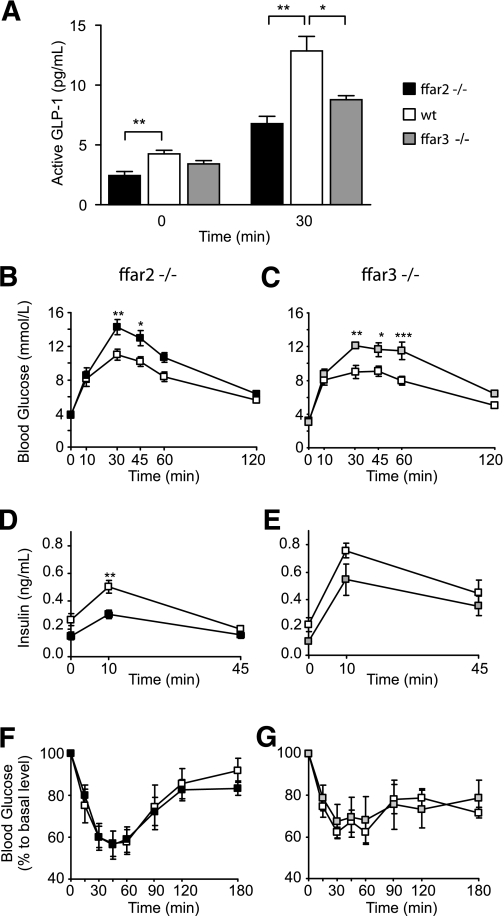
Interest in how the gut microbiome can influence the metabolic state of the host has recently heightened. One postulated link is bacterial fermentation of "indigestible" prebiotics to short-chain fatty acids (SCFAs), which in turn modulate the release of gut hormones controlling insulin release and appetite. We show here that SCFAs trigger secretion of the incretin hormone glucagon-like peptide (GLP)-1 from mixed colonic cultures in vitro. Quantitative PCR revealed enriched expression of the SCFA receptors ffar2 (grp43) and ffar3 (gpr41) in GLP-1-secreting L cells, and consistent with the reported coupling of GPR43 to Gq signaling pathways, SCFAs raised cytosolic Ca2+ in L cells in primary culture. Mice lacking ffar2 or ffar3 exhibited reduced SCFA-triggered GLP-1 secretion in vitro and in vivo and a parallel impairment of glucose tolerance. These results highlight SCFAs and their receptors as potential targets for the treatment of diabetes.


Figures

FIG. 1.
FIG. 1.
SCFAs stimulate GLP-1 secretion. A: Acute stimulation of GLP-1 secretion. Mixed primary cultures from murine colon were incubated for 2 h in 10 mmol/L glucose (Con) or in the additional presence of acetate (Ace) (1 mmol/L), propionate (Pro) (1 mmol/L), or butyrate (But) (1 mmol/L) with or without IBMX (100 μmol/L) as indicated. GLP-1 secretion in each well is expressed relative to the basal secretion (Con) measured in parallel on the same day. Data represent the means ± SEM of the number of wells indicated above each bar. *P < 0.05, **P < 0.01, and ***P < 0.001 compared with their respective controls in the absence or presence of IBMX by one-way ANOVA with post hoc Dunnett test. B: GLP-1 secretion from primary colonic cultures triggered by 140 mmol/L cocktail of SCFAs and an osmotic control of 140 mmol/L NaCl. GLP-1 secretion in each well is expressed relative to the basal secretion measured in parallel on the same day. Data represent the means ± SEM of the number of wells indicated above each bar. **P < 0.01 and ***P < 0.001 compared with baseline and ##P < 0.01 compared with NaCl by Student t test.
FIG. 2.
FIG. 2.
SCFAs raise intracellular calcium in identified colonic L cells. A: Mixed colonic cultures were loaded with fura2-AM. Pseudocolor images of fura2 340:380 nm fluorescence ratio (reflecting [Ca2+]i) shown prior to (basal) and during the application of propionate (1 mmol/L), and after washing with saline. B: Identification of an L cell in the field of view shown in A identified by the fluorescence of Venus (475 nm excitation). C: A representative response of an L and a non–L cell recorded as in A. D: Mean calcium changes in L cells (filled bars) and non–L cells (open bars) after the addition of acetate (1 mmol/L), propionate (1 mmol/L), or CFMB (30 μmol/L) as indicated. Ratios (340:380) in the presence of the test agent were normalized to the mean of the background ratios of each cell measured before addition and after washout of the test compound. Data represent the means ± SEM of the number of cells indicated above each bar. *P < 0.05, **P < 0.01, and ***P < 0.001 compared with baseline and ##P < 0.01 and ###P < 0.001 compared with non–L cells by Student t test. (A high-quality digital representation of this figure is available in the online issue.)
FIG. 3.
FIG. 3.
SCFA receptors FFAR2 and FFAR3 are expressed in L cells. Relative expression of ffar2 (A) and ffar3 (B) mRNAs relative to β-actin assessed by RT-PCR in FACS-sorted L cells and non–L cells from the small intestine (L+ and L, respectively) and colon (LC+ and LC) and the GLUTag model L-cell line. Data are presented as geometric means ± the upper SEM calculated from the log(base 2) data (n = 3 each). Significance comparisons between L cells and non–L cells were calculated by one-way ANOVA with a post hoc Bonferroni correction test performed on the log(base 2) data: *P < 0.05, **P < 0.01, and ***P < 0.001.
FIG. 4.
FIG. 4.
Propionate (Prop) responses are not sensitive to pertussis toxin (Ptx). A: GLP-1 secretion from primary colonic cultures treated with IBMX (100 μmol/L) with or without somatostatin (Sst) (100 nmol/L) in the absence (■) or presence (□) of 0.2 μg/mL pertussis toxin (all n = 3). B: GLP-1 secretion from primary colonic cultures triggered by propionate (1 mmol/L) in the absence and presence of pertussis toxin (0.2 μg/mL). The number of wells is indicated above the bars. Mixed primary cultures from the colon were incubated in bath solution containing reagents as indicated. GLP-1 secretion in each well is expressed relative to the basal secretion (control), measured in parallel on the same day. Data represent the means ± SEM of the number of wells indicated. Statistical significance was assessed by one-way ANOVA with a post hoc Bonferroni correction test: *P < 0.05 and ***P < 0.001.
FIG. 5.
FIG. 5.
ffar2 and ffar3 knockout impairs SCFA-triggered GLP-1 secretion. A: GLP-1 secretion from primary colonic cultures from wild-type, ffar2−/−, and ffar3−/− mice. Mixed primary cultures from the colon from wild-type, ffar3−/−, and ffar2−/− mice were incubated in bath solution containing 10 mmol/L glucose together with acetate (1 mmol/L), propionate (1 mmol/L), and IBMX (100 μmol/L) as indicated (all n = 6). B: GLP-1 secretion from primary colonic cultures from wild-type, ffar2−/−, and ffar3−/− mice triggered by a 140 mmol/L cocktail of SCFAs and an osmotic control of 140 mmol/L NaCl. GLP-1 secretion in each well is expressed relative to the basal secretion (control) measured in parallel on the same day, and error bars represent 1 SEM. Effects of SCFAs in the absence (*P < 0.05, **P < 0.01, and ***P < 0.001) or presence (ΔΔP < 0.01 and ΔΔΔP < 0.001) of IBMX and effects of genotype (#P < 0.05, ##P < 0.01, and ###P < 0.001) were assessed for significance by two-way ANOVA with post hoc Bonferroni correction test. CF: Expression of ffar3 (C), ffar2 (D), gcg (E), and pyy (F) mRNA in colonic tissue isolated from ffar3−/− (n = 5) and ffar2−/− (n = 5) mice and wild-type littermates (n = 6). Expression was normalized to that of β-actin in the same sample. Data are presented as geometric means, and the error bar was calculated from the log(base 2) data. Significance comparisons between genotypes were calculated by one-way ANOVA with a post hoc Dunnett test performed on the log(base 2) data: *P < 0.05 and ***P < 0.001. G: Content of active GLP-1 peptide in colonic tissue isolated from ffar3−/− and ffar2−/− mice and wild-type littermates. Active GLP-1 in colonic extracts was assessed by enzyme-linked immunosorbent assay and is expressed relative to sample protein assessed with a Bradford assay. Significance comparisons between genotypes (n = 6 each) were calculated by one-way ANOVA with a post hoc Dunnett test: *P < 0.05.
FIG. 6.
FIG. 6.
ffar2 and ffar3 knockout mice have impaired glucose tolerance. A: Glucose stimulated GLP-1 secretion in vivo. ffar2−/− and ffar3−/− mice and wild-type littermates (n = 5 each) were dosed with DPP4 inhibitor at a dose of 20 mg/kg per os after a 4-h fast. Thirty minutes post–DPP4 inhibitor dosing, mice were dosed with 1.5 g/kg glucose per os Plasma active GLP-1 was assessed by a MesoScale assay at 0 and 30 min of the oral glucose tolerance test. Data represent means ± 1 SEM, and statistical significance was assessed by Student t test: *P < 0.05 and **P < 0.01. BE: Oral glucose tolerance test in ffar2−/− mice (n = 8) (left panel) and wild-type littermates (n = 11) (B and D) or ffar3−/− mice (n = 7) (right panel) and wild-type littermates (n = 6) (C and E). Following an overnight fast, mice were given 1.5 g/kg glucose per os, and blood glucose (B and C) and insulin (D and E) were measured at the time points indicated. F and G: Insulin tolerance test in ffar2−/− mice (n = 11) (left panel) and wild-type littermates (n = 6) (F) or in ffar3−/− mice (n = 7) (right panel) and wild-type littermates (n = 7) (G). Following a 4-h fast, mice were given 0.75/kg insulin intraperitoneal, and blood glucose was measured at the time points indicated. No significant differences between genotypes were observed. Data in BG represent means ± 1 SEM, and statistical significance was assessed by two-way ANOVA with repeated measures: * P < 0.05, ** P < 0.01, and *** P < 0.001.

References

    1. Gribble FM. RD Lawrence Lecture 2008: targeting GLP-1 release as a potential strategy for the therapy of type 2 diabetes. Diabet Med 2008;25:889–894 - PMC - PubMed
    1. Drucker DJ, Nauck MA. The incretin system: glucagon-like peptide-1 receptor agonists and dipeptidyl peptidase-4 inhibitors in type 2 diabetes. Lancet 2006;368:1696–1705 - PubMed
    1. Madsbad S. Exenatide and liraglutide: different approaches to develop GLP-1 receptor agonists (incretin mimetics)—preclinical and clinical results. Best Pract Res Clin Endocrinol Metab 2009;23:463–477 - PubMed
    1. Dirksen C, Hansen DL, Madsbad S, et al. Postprandial diabetic glucose tolerance is normalized by gastric bypass feeding as opposed to gastric feeding and is associated with exaggerated GLP-1 secretion: a case report. Diabetes Care 2010;33:375–377 - PMC - PubMed
    1. Holst JJ. The physiology of glucagon-like peptide 1. Physiol Rev 2007;87:1409–1439 - PubMed

Publication types

MeSH terms