. 2012 Feb;23(4):657-68.
doi: 10.1091/mbc.E11-02-0108. Epub 2011 Dec 21.

Analysis of yeast endocytic site formation and maturation through a regulatory transition point

Affiliations

Analysis of yeast endocytic site formation and maturation through a regulatory transition point

Susheela Y Carroll et al. Mol Biol Cell. 2012 Feb.

Erratum in

  • Mol Biol Cell. 2012 Aug;23(16):3275

Abstract

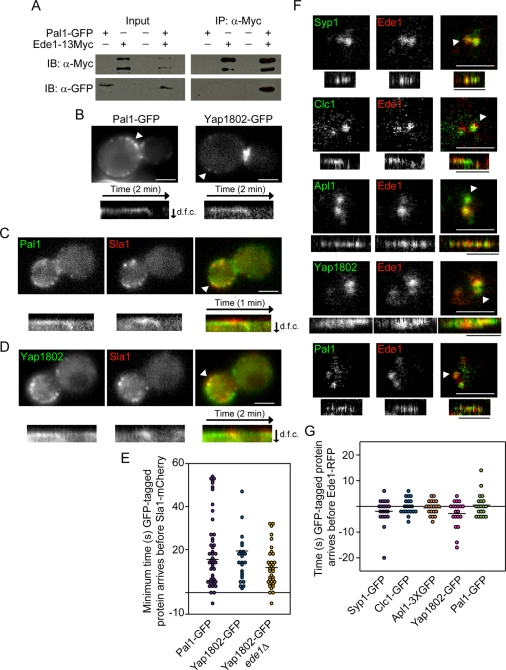
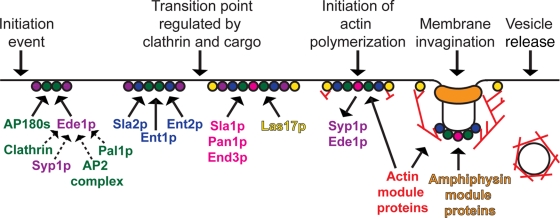
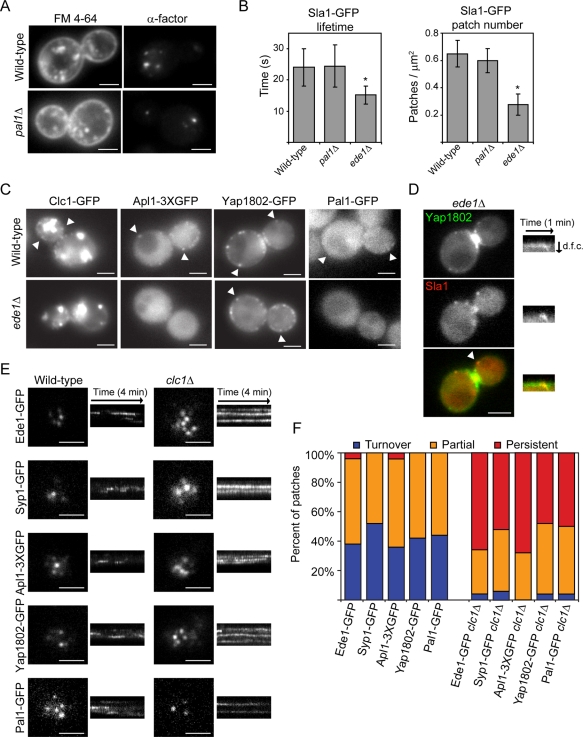
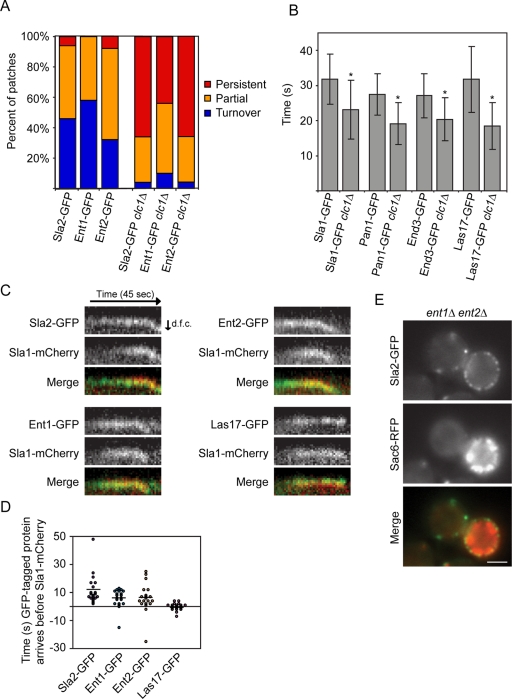
The earliest stages of endocytic site formation and the regulation of endocytic site maturation are not well understood. Here we analyzed the order in which the earliest proteins are detectable at endocytic sites in budding yeast and found that an uncharacterized protein, Pal1p/Ydr348cp, is also present at the initial stages of endocytosis. Because Ede1p (homologue of Eps15) and clathrin are the early-arriving proteins most important for cargo uptake, their roles during the early stages of endocytosis were examined more comprehensively. Ede1p is necessary for efficient recruitment of most early-arriving proteins, but not for the recruitment of the adaptor protein Yap1802p, to endocytic sites. The early-arriving proteins, as well as the later-arriving proteins Sla2p and Ent1/2p (homologues of Hip1R and epsins), were found to have longer lifetimes in CLC1-knockout yeast, which indicates that clathrin light chain facilitates the transition from the intermediate to late coat stages. Cargo also arrives during the early stages of endocytosis, and therefore its effect on endocytic machinery dynamics was investigated. Our results are consistent with a role for cargo in regulating the transition of endocytic sites from the early stages of formation to the late stages during which vesicle formation occurs.


Figures

FIGURE 1:
FIGURE 1:
Analysis of the yeast early endocytic site. (A) Protein lysates from yeast expressing Pal1-GFP and/or Ede1-13Myc were incubated with beads conjugated to an anti-Myc antibody. Pal1-GFP copurifies with Ede1-13Myc. IB, immunoblot; IP, immunoprecipitation. (B) Epifluorescence images of yeast expressing Pal1-GFP or Yap1802-GFP. Kymographs are of the patches indicated by the white arrowheads. (C) Epifluorescence images of a yeast cell expressing Sla1-mCherry and Pal1-GFP. Kymographs of the patch indicated by the white arrowhead are from two-color movies acquired at a rate of one frame per second. (D) Epifluorescence images of a yeast cell expressing Sla1-mCherry and Yap1802-GFP. Kymographs of the patch indicated by the white arrowhead are from two-color movies acquired at a rate of two frames per second. (E). Minimum amount of time the indicated GFP-tagged protein arrived at endocytic sites before Sla1-mCherry (Pal1-GFP, n = 47; Yap1802-GFP, n = 24; Yap1802-GFP ede1Δ, n = 35). In some instances, the GFP-tagged protein was present in the first frame of the movie, so the exact amount of time it was present before Sla1-mCherry arrived is unknown. Negative time represents instances when Sla1-mCherry arrived before the GFP-tagged protein. Horizontal bars represent average time for a group. (F) Two-color TIRF microscopy images of yeast expressing Ede1-RFP and Syp1-GFP, Clc1-GFP, Apl1-3XGFP, Yap1802-GFP, or Pal1-GFP. Kymographs of the patches indicated by the white arrowheads are from two-color movies. Black time bars, 30 s. (G) Amount of time the indicated GFP-tagged protein was detected at sites before Ede1-RFP was detected (n = 20 patches for each strain). Negative time represents instances when Ede1-RFP was detected before the GFP-tagged protein. GFP and RFP tagged proteins were first detected within 4 s of each other ≥80% of the time (n = 20 patches for each strain). Horizontal bars represent average time for a group. All white scale bars, 2 μm. d.f.c., distance from cortex.
FIGURE 2:
FIGURE 2:
Model for the temporal recruitment of endocytic proteins. The early module proteins (Ede1p and Syp1p; purple) and the early coat module proteins (clathrin, the AP2 complex, the yeast AP180s, and Pal1p; green) arrive earliest during endocytic site formation. Ede1p is important for the recruitment of Syp1p, clathrin, the AP2 complex, and Pal1p to endocytic sites. The dashed lines indicate that Ede1p may be involved directly or indirectly in endocytic protein recruitment. Next, the intermediate coat module proteins (Sla2p, Ent1p, and Ent2p; blue) arrive at endocytic sites. Endocytic sites seem to mature through a transition point regulated by clathrin and cargo before the late coat module proteins (Sla1p, Pan1p, and End3p; pink) and Las17p (a WASP/Myo module protein; yellow) are recruited to sites. Ede1p and Syp1p disassemble from endocytic sites at the start of actin polymerization. During membrane invagination, Sla2p, Ent1p, and Ent2p may be involved in connecting the actin network to the vesicle coat and/or plasma membrane.
FIGURE 3:
FIGURE 3:
Analysis of the roles of Pal1p, Ede1p, and Clc1p in endocytosis. (A) FM 4-64 uptake (left) and fluorescent α-factor uptake (right) in the indicated strains after 10 min. (B) Lifetimes of Sla1-GFP patches ± SD (n = 50 patches; left) and Sla1-GFP patch number per cell surface area (μm2) ± SD (n = 20 cells; right) for the indicated yeast. Patch number was counted from maximum-intensity Z-projections of unbudded or large-budded cells. Movies used to generate lifetime data were acquired at a rate of one frame per second. Asterisk indicates a statistically significant decrease compared with wild-type (p < 0.0001). (C) Images of wild-type and ede1Δ yeast expressing Clc1-GFP, Apl1-3XGFP, Yap1802-GFP, or Pal1-GFP. White arrowheads indicate examples of cortical patches. (D) Images of an ede1Δ yeast cell expressing Yap1802-GFP and Sla1-mCherry. Kymographs of the patch indicated by the white arrowhead are from two-color movies. d.f.c., distance from cortex. (E) TIRF microscopy images of wild-type and clc1Δ yeast cell expressing Ede1-GFP, Syp1-GFP, Apl1-3XGFP, Yap1802-GFP, or Pal1-GFP. Kymographs are taken from 4-min movies. (F) Percentage of patches in the indicated strains that assemble and disassemble within a 4-min interval (turnover), are present throughout the TIRF microscopy movie (persistent), or are present in either the first or last frames of the movie (partial; n = 50 patches). All white scale bars, 2 μm.
FIGURE 4:
FIGURE 4:
Sla2p, Ent1p, and Ent2p behave similarly in clc1Δ yeast, have similar localization dynamics, and display similar knockout phenotypes. (A) Percentage of patches in the indicated strains that assemble and disassemble within a 4-min interval (turnover), are present throughout the TIRF microscopy movie (persistent), or are present in either the first or last frames of the movie (partial; n = 50 patches). (B) Lifetime of Sla1-GFP, Pan1-GFP, End3-GFP, and Las17-GFP patches ± SD in wild-type or clc1Δ yeast (n = 50 patches). Movies used to generate lifetime data were acquired at a rate of one frame per second. Asterisk indicates a statistically significant decrease compared with wild type (p < 0.0001). (C) Kymographs from epifluorescence two-color movies of yeast expressing Sla1-mCherry and Sla2-GFP, Ent1-GFP, Ent2-GFP, or Las17-GFP. Movies were acquired at a rate of one frame per second. d.f.c., distance from cortex. (D) Amount of time the indicated GFP-tagged protein arrived before Sla1-mCherry (n = 20 patches for each strain). Negative time represents instances when Sla1-mCherry arrived before the GFP-tagged protein. Horizontal bars represent average time for a group. (E) Fluorescence images of an ent1Δ ent2Δ yeast cell expressing Sla2-GFP and Sac6-RFP. White scale bars, 2 μm.
FIGURE 5:
FIGURE 5:
Endocytic defects in sec18-1ts yeast. (A) Images of wild-type or sec18-1ts yeast expressing GFP-Snc1. Yeast were imaged at room temperature (RT) or incubated at 37°C for 20 min before imaging. (B) Percentage of patches in the indicated strains that assemble and disassemble within a 4-min interval (turnover), are present throughout the TIRF microscopy movie (persistent), or are present in either the first or last frames of the movie (partial; n = 50 patches). Wild-type and mutant strains were incubated at 37°C for 30 min before imaging, except for yeast incubated at 37°C for 30 min and then shifted to 25°C for 20 min before imaging (Ede1-GFP sec18-1ts shift 25°C). (C) FM 4-64 uptake in strains incubated at 37°C for 30 min and then labeled with FM 4-64 for 20 min at 37°C before imaging. (D) Images of wild-type and sec18-1ts yeast expressing GFP-2XPH(PLCδ), which is a marker for PtdIns(4,5)P2. Yeast were incubated at 37°C for 30 min before imaging. (E) Images of Gap1-RFP overexpressed in wild-type or sec18-1ts yeast. Cells were incubated at 37°C for 45 min (i, iv) or 59 min (ii, v), or cells were incubated at 37°C for 45 min and then treated with 0.1% glutamate (wt/vol) for 14 min at 37°C (iii, vi). Insets are line scans of fluorescence intensity (y-axis; arbitrary units) along the three white lines shown. (F) Decrease in the fluorescence intensity (arbitrary units) ± SE of the mean (n = 20 cells) of plasma membrane–localized Gap1-RFP in sec18-1ts yeast incubated at 37°C. Gap1-RFP levels were measured at a 45-min and a 65-min time point in cells that were incubated with (glutamate) or without (untreated) 0.1% glutamate (wt/vol) during this time period. (G) Percentage of Ede1-GFP patches in sec18-1ts yeast overexpressing Gap1-RFP that are turnover, persistent, or partial patches (4-min TIRF microscopy movie; n = 50 patches). Yeast were incubated at 37°C for 55 min (untreated) or incubated at 37°C for 45 min and treated with 0.1% glutamate for 10 min at 37°C (glutamate) before imaging. (H) Sla1-GFP patch number per cell surface area (μm2) ± SD (n = 20 cells) for wild-type and sec18-1ts yeast overexpressing Gap1-RFP. Yeast were incubated at 37°C for 55 min (untreated) or incubated at 37°C for 45 min and treated with 0.1% glutamate for 10 min at 37°C (glutamate) before imaging. Patch number was counted from maximum-intensity Z-projections of unbudded or large-budded cells. All white scale bars, 2 μm.

References

    1. Aguilar RC, et al. Epsin N-terminal homology domains perform an essential function regulating Cdc42 through binding Cdc42 GTPase-activating proteins. Proc Natl Acad Sci USA. 2006;103:4116–4121. - PMC - PubMed
    1. Baggett JJ, Shaw JD, Sciambi CJ, Watson HA, Wendland B. Fluorescent labeling of yeast. Curr Protoc Cell Biol. 2003;Chapter 14 Unit 4.13. - PubMed
    1. Bai J, Hu Z, Dittman JS, Pym EC, Kaplan JM. Endophilin functions as a membrane-bending molecule and is delivered to endocytic zones by exocytosis. Cell. 2010;143:430–441. - PMC - PubMed
    1. Barker SL, Lee L, Pierce BD, Maldonado-Baez L, Drubin DG, Wendland B. Interaction of the endocytic scaffold protein Pan1 with the type I myosins contributes to the late stages of endocytosis. Mol Biol Cell. 2007;18:2893–2903. - PMC - PubMed
    1. Boettner DR, D'Agostino JL, Torres OT, Daugherty-Clarke K, Uygur A, Reider A, Wendland B, Lemmon SK, Goode BL. The F-BAR protein Syp1 negatively regulates WASp-Arp2/3 complex activity during endocytic patch formation. Curr Biol. 2009;19:1979–1987. - PMC - PubMed

Publication types

MeSH terms

Substances