. 2011:2011:608295.
doi: 10.1155/2011/608295. Epub 2011 Nov 29.

An integrated framework to model cellular phenotype as a component of biochemical networks

Affiliations

An integrated framework to model cellular phenotype as a component of biochemical networks

Michael Gormley et al. Adv Bioinformatics. 2011.

Abstract

Identification of regulatory molecules in signaling pathways is critical for understanding cellular behavior. Given the complexity of the transcriptional gene network, the relationship between molecular expression and phenotype is difficult to determine using reductionist experimental methods. Computational models provide the means to characterize regulatory mechanisms and predict phenotype in the context of gene networks. Integrating gene expression data with phenotypic data in transcriptional network models enables systematic identification of critical molecules in a biological network. We developed an approach based on fuzzy logic to model cell budding in Saccharomyces cerevisiae using time series expression microarray data of the cell cycle. Cell budding is a phenotype of viable cells undergoing division. Predicted interactions between gene expression and phenotype reflected known biological relationships. Dynamic simulation analysis reproduced the behavior of the yeast cell cycle and accurately identified genes and interactions which are essential for cell viability.


Figures

Figure 1
Figure 1
Graphical depictions of best fit models identified using the fuzzy logic model-fitting procedure. Nodes representing genes are colored according to the phase of the cell cycle in which they reach peak expression. (Blue: G1 expression, red: M expression, green: M/G1 expression, white: phenotype/expression independent of cell cycle progression.) Edges between nodes represent inferred physical/genetic/indirect interactions between genes and gene products. Blue lines indicate positive interactions. Red lines indicate negative interactions. Dashed lines indicate biphasic interactions. (a) Best fit models for expression of each gene and the fraction of budding cells (phenotype) were identified by exhaustive search through the solution space using fuzzy logic. (b) Network diagram of integrated best fit models. Nodes are organized according to the phase of the cell cycle in which they reach peak expression.
Figure 2
Figure 2
Observed and predicted fraction of budding cells at different time points in cell cycle progression. The red line and associated data points indicate the observed fraction of budding cells. The blue line indicates the fraction of budding cells predicted on the basis of gene expression. The green line indicates the fraction of budding cells predicted at convergence of the dynamic model. The fuzzy rules used to predict the fraction of budding cells are as follows: SIC1 (3,3, 1); CLN3 (3,1, 1); CLB6 (3,3, 1); CLB1 (1,1, 3); SWI5 (1,1, 3).
Figure 3
Figure 3
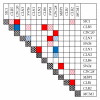
In silico gene knock-down models predict the viability of synthetic lethal and synthetic rescue double-gene knock-out experiments. The outcomes of double-gene knock-out experiments were obtained from publications compiled by the Saccharomyces Genome Database [20]. Pairs of genes that form synthetic phenotypes are identified by the color of the squares at the intersection of rows and columns. Experimentally observed synthetic lethal and synthetic rescue mutations are indicated by red and blue squares, respectively. The predicted outcome of double-gene knockouts is indicated by the pattern of the squares. Correct and incorrect predictions are marked with filled and diagonally hashed squares, respectively. Seven out of thirteen synthetic lethal and two out of five synthetic rescue phenotypes are correctly predicted.
Figure 4
Figure 4
Heat map indicating the frequency of input gene selection in the top 100 best-fit rules for each output gene and fraction of budding cells. Input genes are ordered along the horizontal axis. Output genes are ordered along the vertical axis. The color of a square i, j represents the frequency with which input gene i is observed among the top 100 best-fit rules for output gene (or phenotype) j.
Figure 5
Figure 5
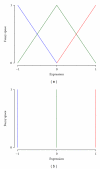
Membership function and defuzzification function used for converting gene expression values from continuous to fuzzy space and back. (a) Membership function describing the transformation of gene expression values into three fuzzy sets of low (blue), medium (green), and high (red) expression. (b) Point set definitions for defuzzification of fuzzy gene expression values via the simplified centroid method.

References

    1. Hautaniemi S, Kharait S, Iwabu A, Wells A, Lauffenburger DA. Modeling of signal-response cascades using decision tree analysis. Bioinformatics. 2005;21(9):2027–2035. - PubMed
    1. Asthagiri AR, Lauffenburger DA. Bioengineering models of cell signaling. Annual Review of Biomedical Engineering. 2000;2(2000):31–53. - PubMed
    1. Covert MW, Knight EM, Reed JL, Herrgard MJ, Palsson BO. Integrating high-throughput and computational data elucidates bacterial networks. Nature. 2004;429(6987):92–96. - PubMed
    1. Kharait S, Hautaniemi S, Wu S, Iwabu A, Lauffenburger DA, Wells A. Decision tree modeling predicts effects of inhibiting contractility signaling on cell motility. BMC Systems Biology. 2007;1, article 9 - PMC - PubMed
    1. Chen KC, Calzone L, Csikasz-Nagy A, Cross FR, Novak B, Tyson JJ. Integrative analysis of cell cycle control in budding yeast. Molecular Biology of the Cell. 2004;15(8):3841–3862. - PMC - PubMed