. 2011:2011:935160.
doi: 10.1155/2011/935160. Epub 2011 Dec 4.

Role of oxidative stress in transformation induced by metal mixture

Affiliations

Role of oxidative stress in transformation induced by metal mixture

Silva-Aguilar Martín et al. Oxid Med Cell Longev. 2011.

Abstract

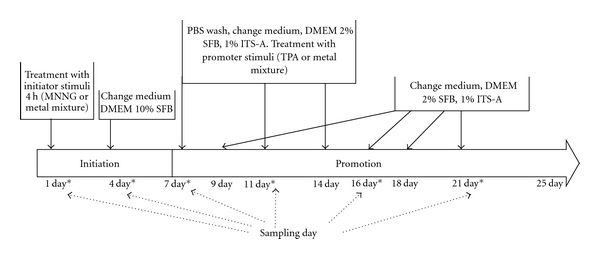
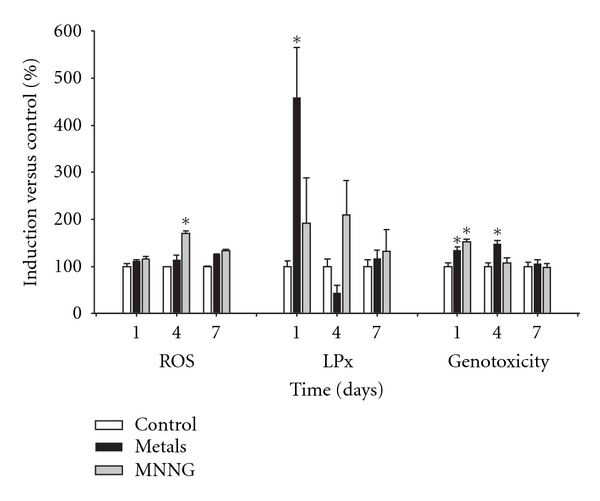
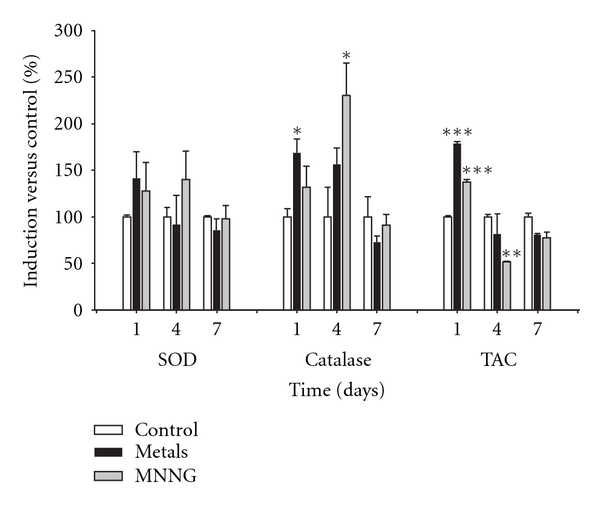
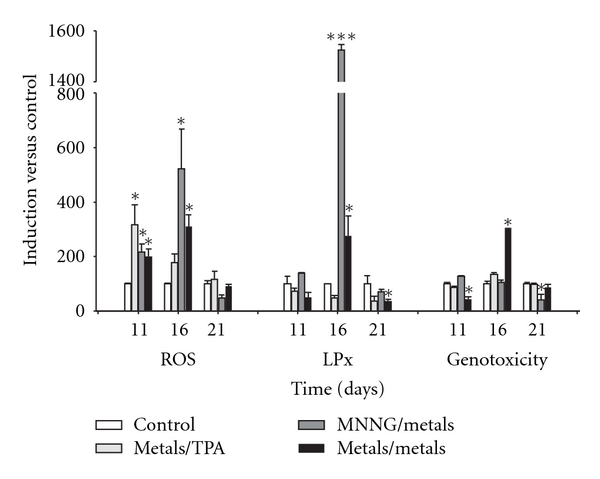
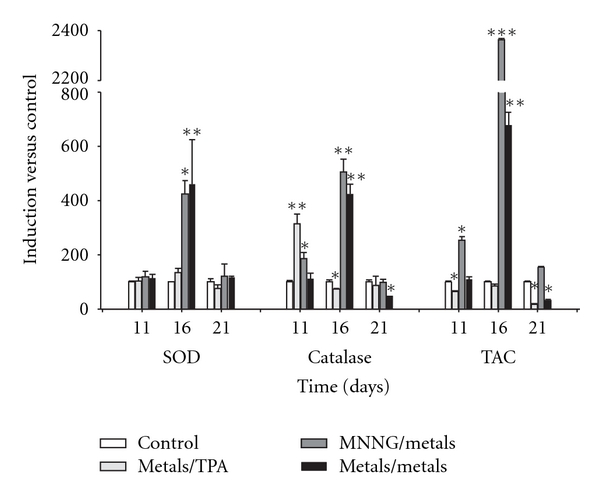
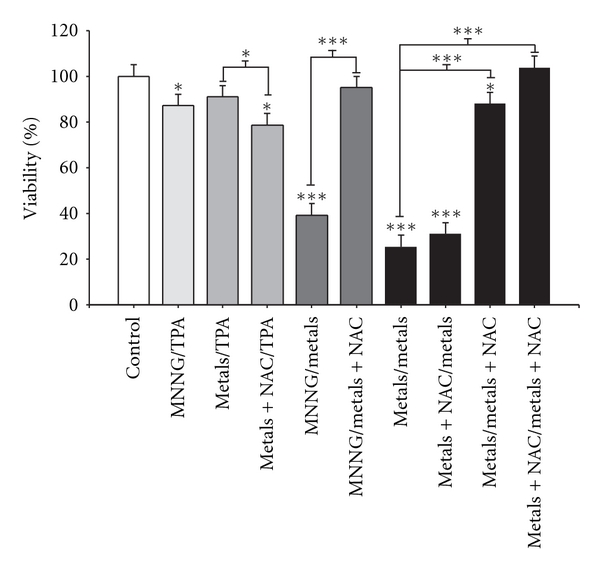
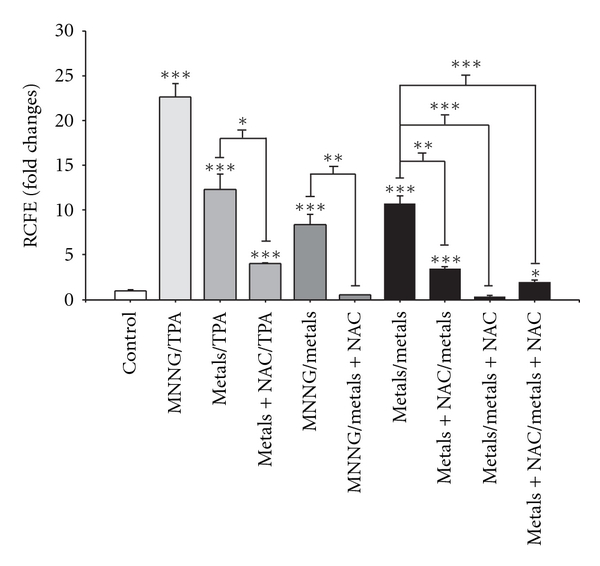
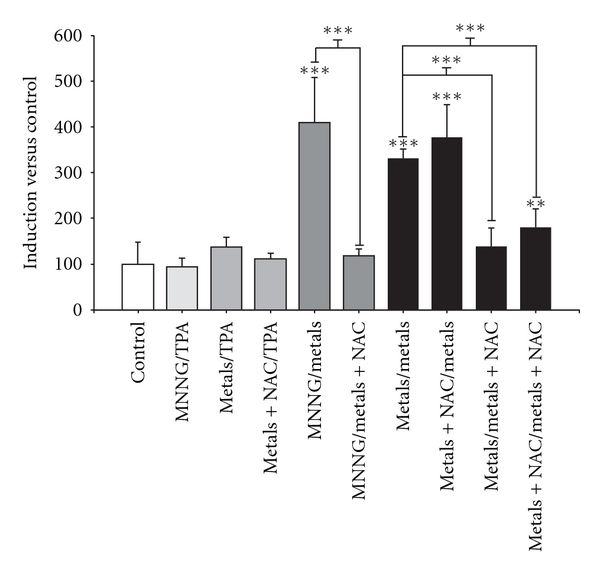
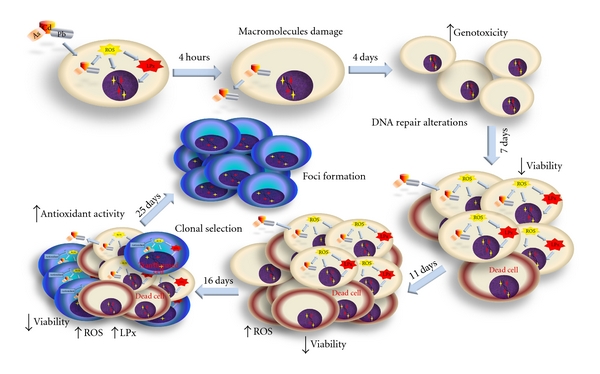
Metals are ubiquitous pollutants present as mixtures. In particular, mixture of arsenic-cadmium-lead is among the leading toxic agents detected in the environment. These metals have carcinogenic and cell-transforming potential. In this study, we used a two step cell transformation model, to determine the role of oxidative stress in transformation induced by a mixture of arsenic-cadmium-lead. Oxidative damage and antioxidant response were determined. Metal mixture treatment induces the increase of damage markers and the antioxidant response. Loss of cell viability and increased transforming potential were observed during the promotion phase. This finding correlated significantly with generation of reactive oxygen species. Cotreatment with N-acetyl-cysteine induces effect on the transforming capacity; while a diminution was found in initiation, in promotion phase a total block of the transforming capacity was observed. Our results suggest that oxidative stress generated by metal mixture plays an important role only in promotion phase promoting transforming capacity.


Figures

Figure 1
Figure 1
Scheme of two-phase transformation protocol, Balb/c 3T3 cells. Initiation phase, day 1 to 7. On day 1, subconfluent cell culture was treated with MNNG 0.5 μg/mL (positive initiator) or metal mixture (2 μM NaAsO2, 2 μM CdCl2, and 5 μM Pb(C2H3O2)2·3H2O) as initiator stimuli during 4 h and reseeded in DMEM medium supplemented with 10% SFB. On day 4 medium was changed. Promotion phase begins on day 7 and ends on day 25. In promotion phase, cells were cultured in DMEM medium supplemented with 2% SFB and 1% ITS-A. On days 7, 11, and 14 cells were treated with TPA 0.1 μg/mL (positive promoter) or metal mixture (2 μM NaAsO2, 2 μM CdCl2 and 5 μM Pb(C2H3O2)2·3H2O) as promoter stimuli. Meanwhile, on days 9, 16, 18, and 21 medium changes were done. Sampling days across transformation protocol are represented by “*”; in these days samples were taken before changing media or applying treatment.
Figure 2
Figure 2
Effects of the metal mixture through initiation phase of transformation process, oxidative damage markers. Balb/c 3T3 cells were exposed to an initiator stimuli, metal mixture (2 μM NaAsO2, 2 μM CdCl2, and 5 μM Pb(C2H3O2)2·3H2O) or MNNG (positive initiator), on day 1. Samplings were on days 1, after 4 hours of initiator exposure, and on days 4 and 7 before changing medium. Data represent the mean of 3 individual experiments performed by triplicate. We evaluated the generation of reactive oxygen species (ROS) using dihydrorhodamine-123 oxidation. Lipid peroxidation (LPx) was assessed using the thiobarbituric acid method, and genotoxicity was determined using the alkaline comet assay. ANOVA and Student's t-test; *P < 0.05 versus control bars.
Figure 3
Figure 3
Effects of the metal mixture through initiation phase of transformation process, antioxidant activity markers. Balb/c 3T3 cells were exposed to initiator stimuli, metal mixture (2 μM NaAsO2, 2 μM CdCl2, and 5 μM Pb(C2H3O2)2·3H2O) or MNNG (positive initiator), on day 1. Samplings were on days 1, after 4 hours of initiator exposure, and on days 4 and 7 before changing medium. Data represent the mean of 3 individual experiments performed by triplicate. Antioxidant activity is represented as a percentage with respect to control values. Superoxide dismutase (SOD) and catalase activities were evaluated using spectrophotometric assays, and the total antioxidant capacity (TAC) was assessed by the ABTS° + radical method (ANOVA and Student's t-test; *P < 0.05, **P < 0.001, ***P < 0.0001 versus control bars).
Figure 4
Figure 4
Effects of the metal mixture (2 μM NaAsO2, 2 μM CdCl2, and 5 μM Pb(C2H3O2)2·3H2O) through promotion phase of transformation process, oxidative damage markers. Balb/c 3T3 cells were exposed 4 hours to initiator stimuli, metal mixture or MNNG (positive initiator), on day 1 and promoter stimuli, metal mixture or TPA (positive promoter), on days 7, 11, and 14. Samplings were on days 11, 16, and 21 of the transformation protocol for monitoring promotion phase. Data represent the mean of 3 individual experiments performed by triplicate. We evaluated the generation of reactive oxygen species (ROS) using dihydrorhodamine-123 oxidation. Lipid peroxidation (LPx) was assessed using the thiobarbituric acid method, and genotoxicity was determined using the alkaline comet assay. ANOVA and Student's t-test; *P < 0.05, ***P < 0.0001 versus control bars.
Figure 5
Figure 5
Effects of the metal mixture (2 μM NaAsO2, 2 μM CdCl2, and 5 μM Pb(C2H3O2)2·3H2O) through promotion phase of transformation process, antioxidant activity markers. Balb/c 3T3 cells were exposed 4 hours to initiator stimuli, metal mixture or MNNG (positive initiator), on day 1 and promoter stimuli, metal mixture or TPA (positive promoter), on days 7, 11, and 14. Samplings were on days 11, 16, and 21 of the transformation protocol for monitoring promotion phase. Data represent the mean of 3 individual experiments performed by triplicate. Antioxidant activity is represented as a percentage with respect to control values. Superoxide dismutase (SOD) and catalase activities were evaluated using spectrophotometric assays, and the total antioxidant capacity (TAC) was assessed by the ABTS° + radical method (ANOVA and Student's t-test; *P < 0.05, **P < 0.001, ***P < 0.0001 versus control bars).
Figure 6
Figure 6
Influence of N-acetyl-cysteine (NAC) on metal-mixture-induced transformation, cell viability determination. Cells were cotreated with 10 mM NAC and the metal mixture (2 μM NaAsO2, 2 μM CdCl2, and 5 μM Pb(C2H3O2)2·3H2O); samples were collected on day 16. Data represent the mean of three independent experiments performed in triplicate. Cell viability is presented as the percentage with respect to control values, as determined by the metabolic dual stain. ANOVA and Student's t-test *P < 0.05, ***P < 0.0001.
Figure 7
Figure 7
Influence of N-acetyl-cysteine (NAC) on metal-mixture-induced transformation, number of transformation foci per dish. Cells were cotreated with 10 mM NAC and the metal mixture (2 μM NaAsO2, 2 μM CdCl2, and 5 μM Pb(C2H3O2)2·3H2O); samples were collected on day 25. Data represent the mean of three independent experiments performed in triplicate. Transformation is presented as the fold change with respect to control values. This value corresponds to the number of foci/dish in the experimental condition over the number of foci/dish in control samples. The results are presented as a percentage with respect to control values. ANOVA and Student's t-test *P < 0.05, **P < 0.001, ***P < 0.0001.
Figure 8
Figure 8
Influence of N-acetyl-cysteine (NAC) on metal-mixture-induced transformation, lipid peroxidation. Cells were cotreated with 10 mM NAC and the metal mixture (2 μM NaAsO2, 2 μM CdCl2, and 5 μM Pb(C2H3O2)2·3H2O); samples were collected on day 16. Data represent the mean of three independent experiments performed in triplicate. LPx was measured as an oxidative stress marker. The results are presented as a percentage with respect to control values, as determined by the thiobarbituric acid method (ANOVA and Student's t test **P < 0.001, ***P < 0.0001).
Figure 9
Figure 9
Scheme of metal mixture transformation process in Balb c/3T3. We show that damage to macromolecules (lipids and DNA) occurs the first day of initiation phase with no change in cell viability, suggesting that DNA repair systems may have been impaired by the metal mixture treatment (2 μM NaAsO2, 2 μM CdCl2, and 5 μM Pb(C2H3O2)2·3H2O), in addition to the observed genotoxicity. During the promotion phase, clonal selection of the transformed cells was clearly observed, as evidenced by an increase in oxidative stress markers, induction of the antioxidant response, and loss of cell viability. Cells with various advantages survived, such as those with a high antioxidant capacity until foci formation.

References

    1. Carrizales L, Razo I, Téllez-Hernández JI, et al. Exposure to arsenic and lead of children living near a copper-smelter in San Luis Potosi, Mexico: importance of soil contamination for exposure of children. Environmental Research. 2006;101(1):1–10. - PubMed
    1. Bae DS, Gennings C, Carter WH, Jr., Yang RSH, Campain JA. Toxicological interactions among arsenic, cadmium, chromium, and lead in human keratinocytes. Toxicological Sciences. 2001;63(1):132–142. - PubMed
    1. de Burbure C, Buchet JP, Leroyer A, et al. Renal and neurologic effects of cadmium, lead, mercury, and arsenic in children: evidence of early effects and multiple interactions at environmental exposure levels. Environmental Health Perspectives. 2006;114(4):584–590. - PMC - PubMed
    1. Wang G, Fowler BA. Roles of biomarkers in evaluating interactions among mixtures of lead, cadmium and arsenic. Toxicology and Applied Pharmacology. 2008;233(1):92–99. - PubMed
    1. ATSDR. Priority List of Hazardous Substances. Agency for Toxic Substances and Disease Registry, U.S. Department of Health and Human Services; 2007.

Publication types