

Do social inequalities in health widen or converge with age? Longitudinal evidence from three cohorts in the West of Scotland
- PMID: 22192620
- PMCID: PMC3265552
- DOI: 10.1186/1471-2458-11-947
Do social inequalities in health widen or converge with age? Longitudinal evidence from three cohorts in the West of Scotland
Abstract
Background: Existing studies are divided as to whether social inequalities in health widen or converge as people age. In part this is due to reliance on cross-sectional data, but also among longitudinal studies to differences in the measurement of both socioeconomic status (SES) and health and in the treatment of survival effects. The aim of this paper is to examine social inequalities in health as people age using longitudinal data from the West of Scotland Twenty-07 Study to investigate the effect of selective mortality, the timing of the SES measure and cohort on the inequality patterns.
Methods: The Twenty-07 Study has followed three cohorts, born around 1932, 1952 and 1972, from 1987/8 to 2007/8; 4,510 respondents were interviewed at baseline and, at the most recent follow-up, 2,604 were interviewed and 674 had died. Hierarchical repeated-measures models were estimated for self-assessed health status, with and without mortality, with baseline or time-varying social class, sex and cohort.
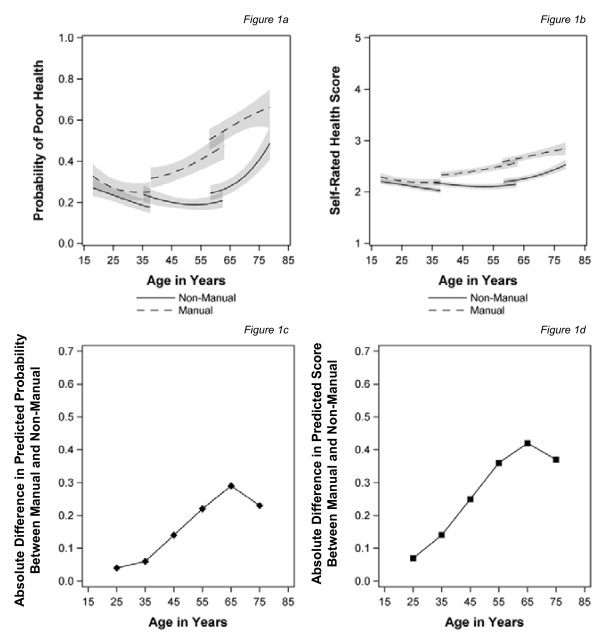
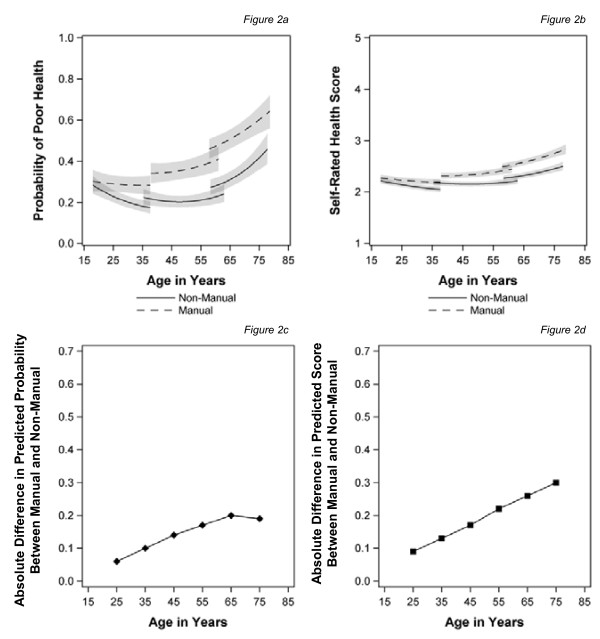
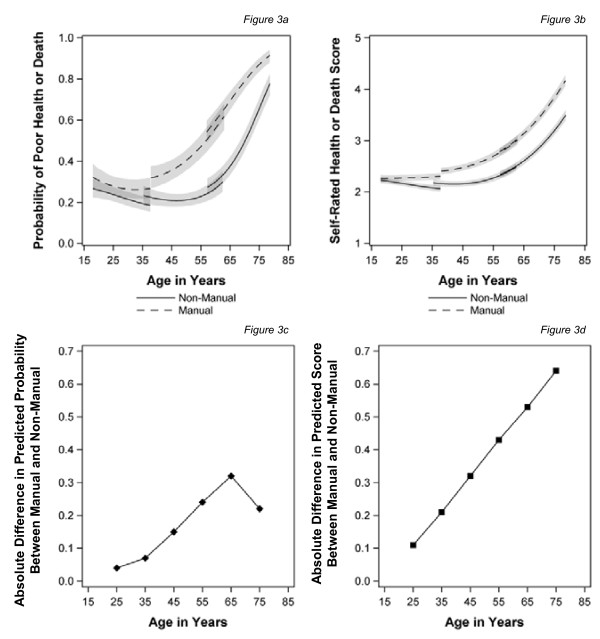
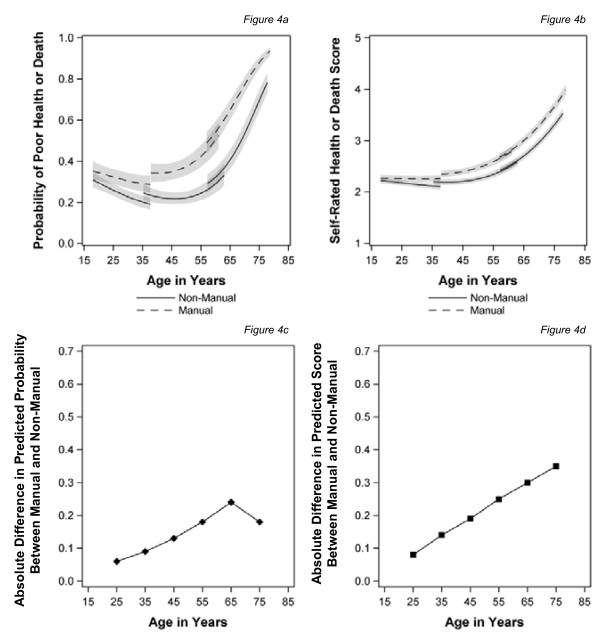
Results: Social inequalities in health emerge around the age of 30 after which they widen until the early 60s and then begin to narrow, converging around the age of 75. This pattern is a result of those in manual classes reporting poor health at younger ages, with the gap narrowing as the health of those in non-manual classes declines at older ages. However, employing a more proximal measure of SES reduces inequalities in middle age so that convergence of inequalities is not apparent in old age. Including death in the health outcome steepens the health trajectories at older ages, especially for manual classes, eliminating the convergence in health inequalities, suggesting that healthy survival effects are important. Cohort effects do not appear to affect the pattern of inequalities in health as people age in this study.
Conclusions: There is a general belief that social inequalities in health appear to narrow at older ages; however, taking account of selective mortality and employing more proximal measures of SES removes this convergence, suggesting inequalities in health continue into old age.
Figures
References
-
- Townsend P, Whitehead M, Davidson N. Inequalities in health: The Black Report and the Health Divide. New edn. London: Penguin Books; 1992.
-
- CSDH (Commission on Social Determinants of Health) Closing the gap in a generation: Health equity through action on the social determinants of health. Final Report of the Commission on Social Determinants of Health. Geneva: World Health Organization; 2008.
-
- Acheson D. Independent Inquiry into Inequalities in Health Report Chairman: Sir Donald Acheson. London: The Stationery Office; 1998.
-
- Huisman M, Kunst AE, Andersen O, Bopp M, Borgan JK, Borrell C, Costa G, Deboosere P, Desplanques G, Donkin A. et al.Socioeconomic inequalities in mortality among elderly people in 11 European populations. J Epidemiol Community Health. 2004;58:468–475. doi: 10.1136/jech.2003.010496. - DOI - PMC - PubMed
Publication types
MeSH terms
Grants and funding
LinkOut - more resources
Full Text Sources
Medical
Miscellaneous
