. 2011 Dec 22;7(1):118-27.
doi: 10.1038/nprot.2011.430.

Comprehensive qPCR profiling of gene expression in single neuronal cells

Affiliations

Comprehensive qPCR profiling of gene expression in single neuronal cells

Ami Citri et al. Nat Protoc. .

Abstract

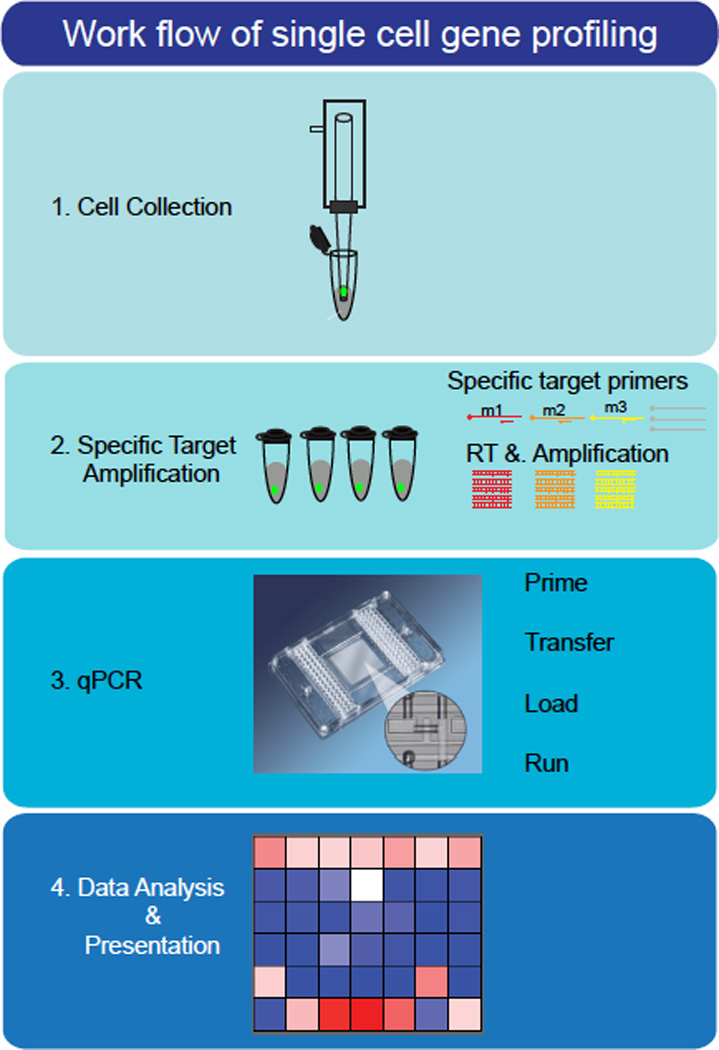
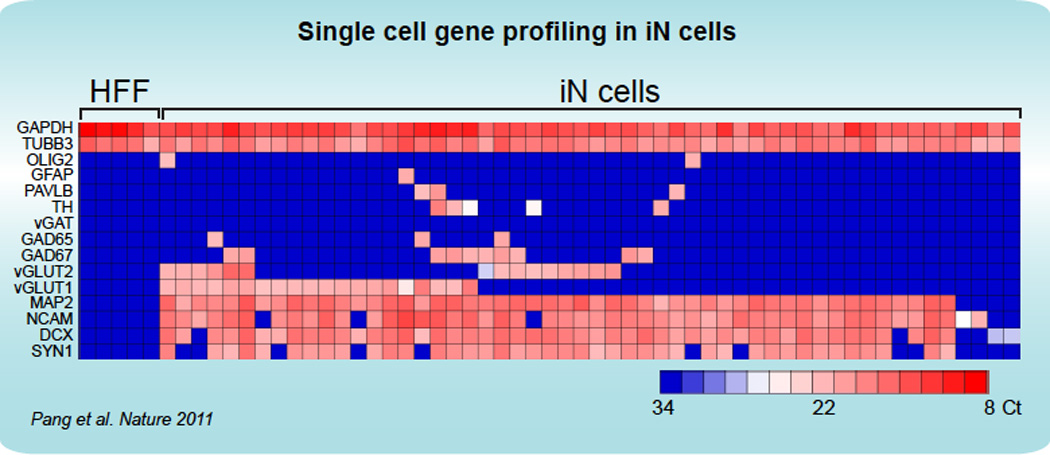
A major challenge in neuronal stem cell biology lies in characterization of lineage-specific reprogrammed human neuronal cells, a process that necessitates the use of an assay sensitive to the single-cell level. Single-cell gene profiling can provide definitive evidence regarding the conversion of one cell type into another at a high level of resolution. The protocol we describe uses Fluidigm Biomark dynamic arrays for high-throughput expression profiling from single neuronal cells, assaying up to 96 independent samples with up to 96 quantitative PCR (qPCR) probes (equivalent to 9,216 reactions) in a single experiment, which can be completed within 2-3 d. The protocol enables simple and cost-effective profiling of several hundred transcripts from a single cell, and it could have numerous utilities.


Figures

FIGURE 1
FIGURE 1
A schematic workflow for single cell gene profiling. The procedure for single cell gene profiling consists of four major steps: 1. Collecting cells (for detailed explanation see Box 2); 2. Specific target amplifications (STA) using a mix of gene-specific primer pairs. M1 to M3 represent genes of interest, gray mRNAs represent other genes. Target RNAs are subject to reverse transcription and amplification; 3. Quantitative PCR, performed on the Fluidigm Biomark system. Samples are loaded on one side of the array, while probes are loaded on the opposing side, with mixing occurring only in the appropriate wells, allowing high-throughput parallel analysis of multiple samples across multiple probes; 4. Data analysis and presentation. At this point, quality assurance is performed to ensure the specificity and reliability of the results, followed by data analysis and presentation (potentially in the form of a heatmap).
FIGURE 2
FIGURE 2
Single-cell gene expression profiling using Fluidigm dynamic arrays. Rows represent the evaluated genes and columns represent individual cells. Heat map (blue to red) represents the threshold Ct values as indicated. HFF = Human Fetal Fibroblast; iN = inducible Neuron. (from Pang et al., Nature 2011)
BOX FIGURE 1
BOX FIGURE 1
Assessment of primer efficiency and specificity. a, An example of amplification curves using Fluidigm IFC arrays. 6 4-fold sequential dilutions of total human brain RNA are shown, probed for expression of vGLUT2. b, The efficiency of the primer pair for vGLUT2 was assessed by plotting the cycle threshold value (Ct) at each concentration against the logarithm of the fold dilution of the sample. The slope of a linear-regression trendline is indicative of primer efficiency, as defined in the text. c, An example of melting curve analysis, demonstrating the specific amplification of the target gene in the majority of the single cell samples tested, as well as a non-specific amplification observed in a single sample (indicated by an arrow).
BOX FIGURE 2
BOX FIGURE 2
Aspiration of single cells. a, A schematic illustration of the method for collection single cells using a patch pipette. Initially, a patch pipette with a tip opening of 2 to 3 µm (~0.5 Mohm resistance) is fixed to the pipette holder, which is attached through plastic tubing to a 3 ml syringe. Slight positive pressure (pres.) is applied through the syringe while inserting the pipette into the media on the dish containing the target neuronal cells. Target cells are identified by their GFP expression and neuronal morphology, as assessed by differential-interference contrast (DIC) imaging. The positive pressure driven through the pipette while it is lowered into the solution reduces the influx of liquid into the pipette due to capillary action. Under visual direction through the microscope, a micromanipulator is used to position the pipette close to the cell body. Once the tip touches the cell, the cell will normally adhere to the tip, at this point the pressure is relieved, and slight suction (suc.) applied, enabling gradual aspiration of the cell into the pipette tip. The pipette is then retracted, and while positioning it in a pre-prepared PCR tube with 5 µl reaction buffer, the syringe is used to apply positive pressure to expel the cell into the solution in the tube. b, Fluorescent and DIC image of the collection of an iN cell as described.

References

    1. Dolmetsch R, Geschwind DH. The Human Brain in a Dish: The Promise of iPSC-Derived Neurons. Cell. 2011;145(6):831. - PMC - PubMed
    1. Li HH, et al. Amplification and analysis of DNA sequences in single human sperm and diploid cells. Nature. 1988;335(6189):414. - PubMed
    1. Cauli B, et al. Molecular and physiological diversity of cortical nonpyramidal cells. J Neurosci. 1997;17(10):3894. - PMC - PubMed
    1. Cauli Bruno, Lambolez Bertrand. Unravelling Single Cell Genomics. The Royal Society of Chemistry; 2010. p. 81.
    1. Koirala S, Corfas G. Identification of novel glial genes by single-cell transcriptional profiling of Bergmann glial cells from mouse cerebellum. PLoS One. 2011;5(2):e9198. - PMC - PubMed

Publication types