. 2012 Feb 21;12(4):731-40.
doi: 10.1039/c2lc20896b. Epub 2011 Dec 23.

A silicone-based stretchable micropost array membrane for monitoring live-cell subcellular cytoskeletal response

Affiliations

A silicone-based stretchable micropost array membrane for monitoring live-cell subcellular cytoskeletal response

Jennifer M Mann et al. Lab Chip. .

Abstract

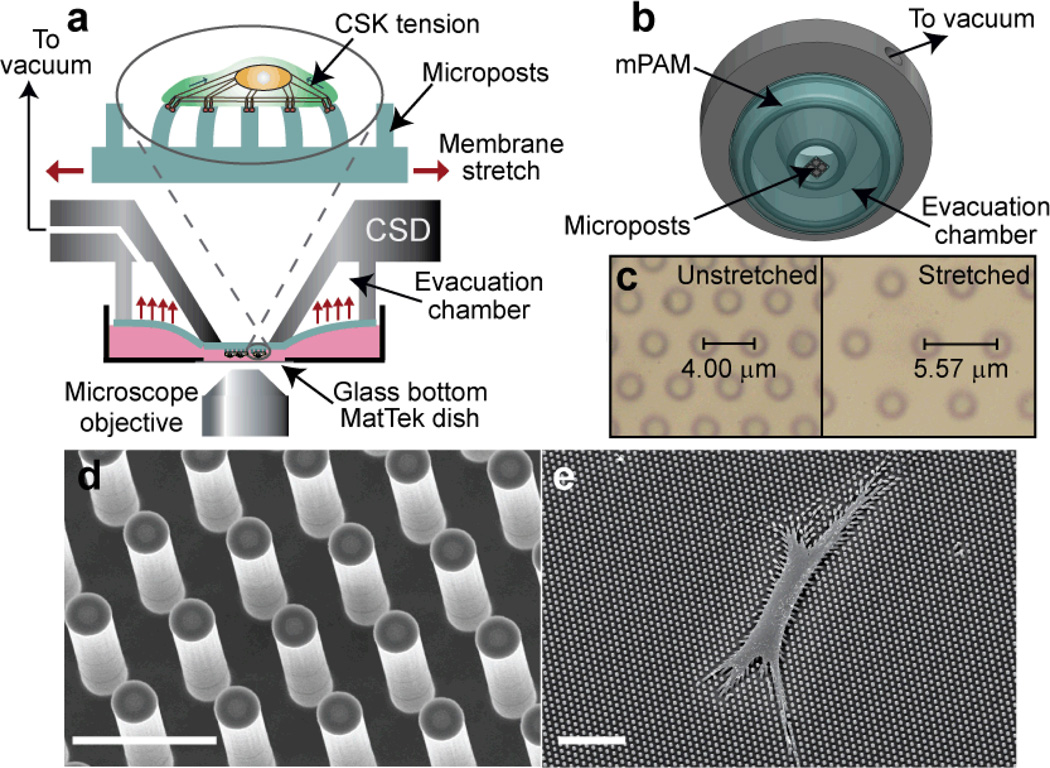
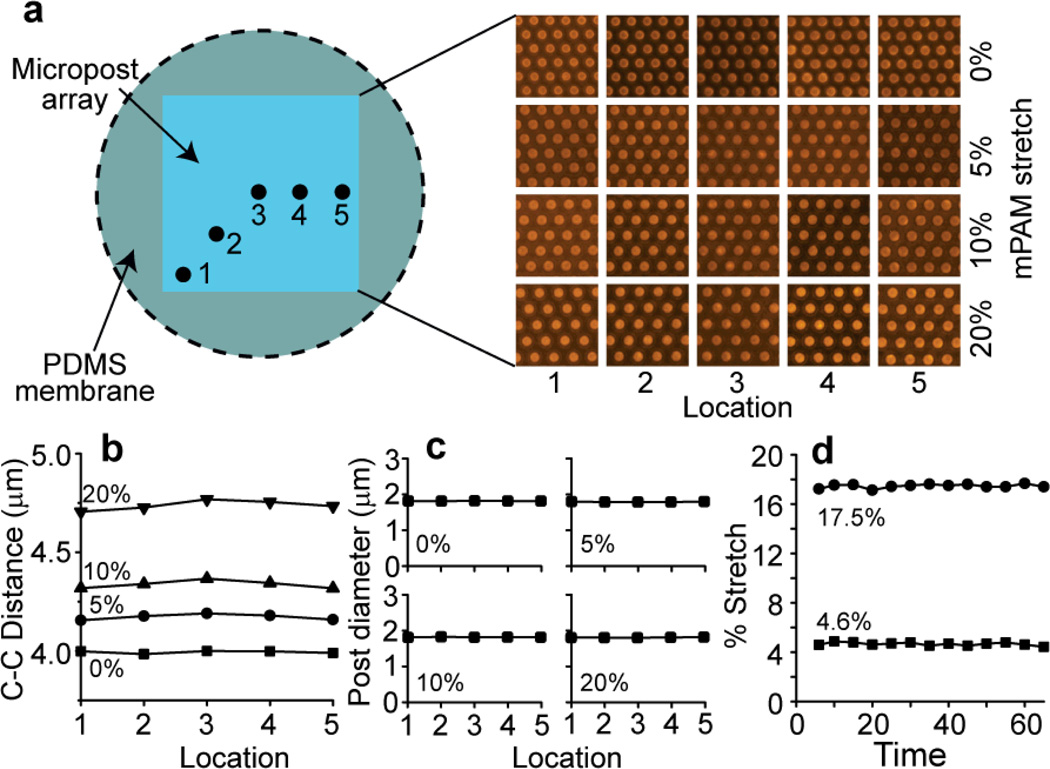
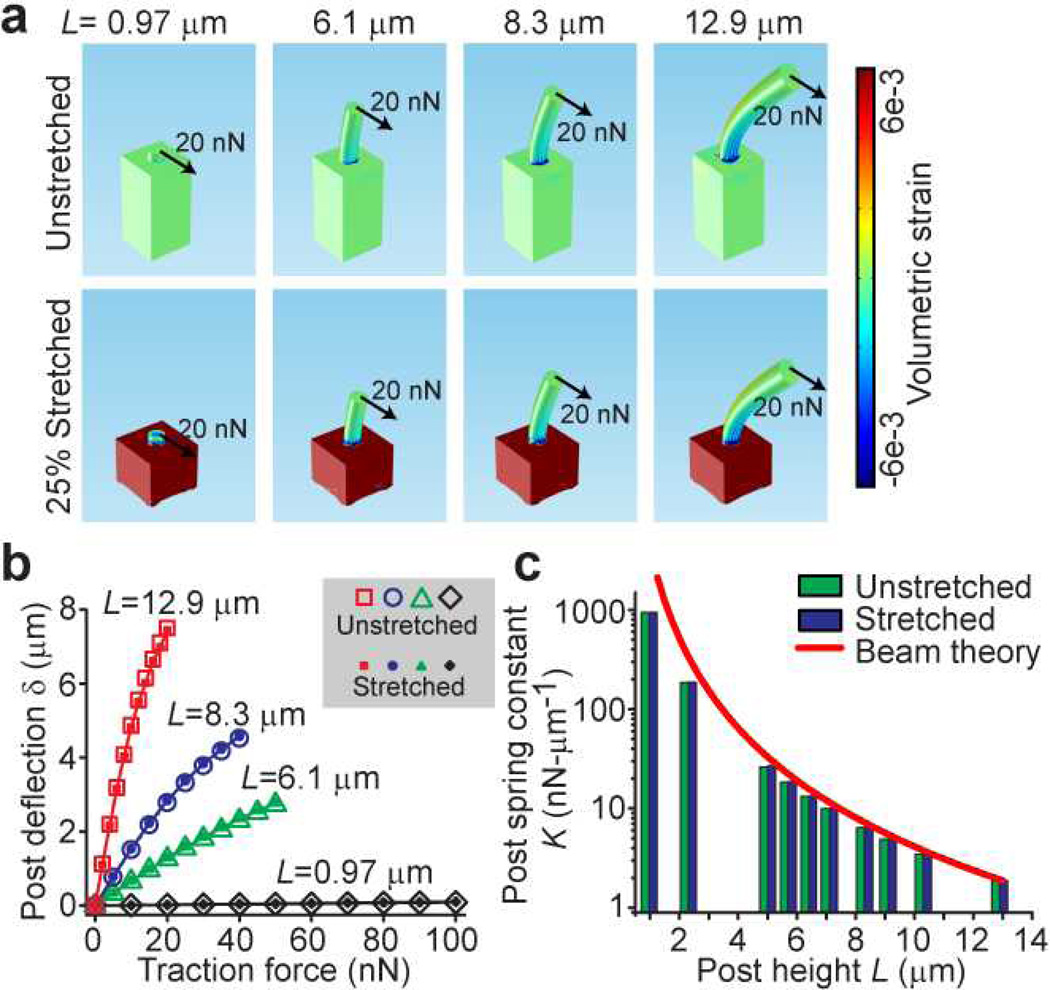
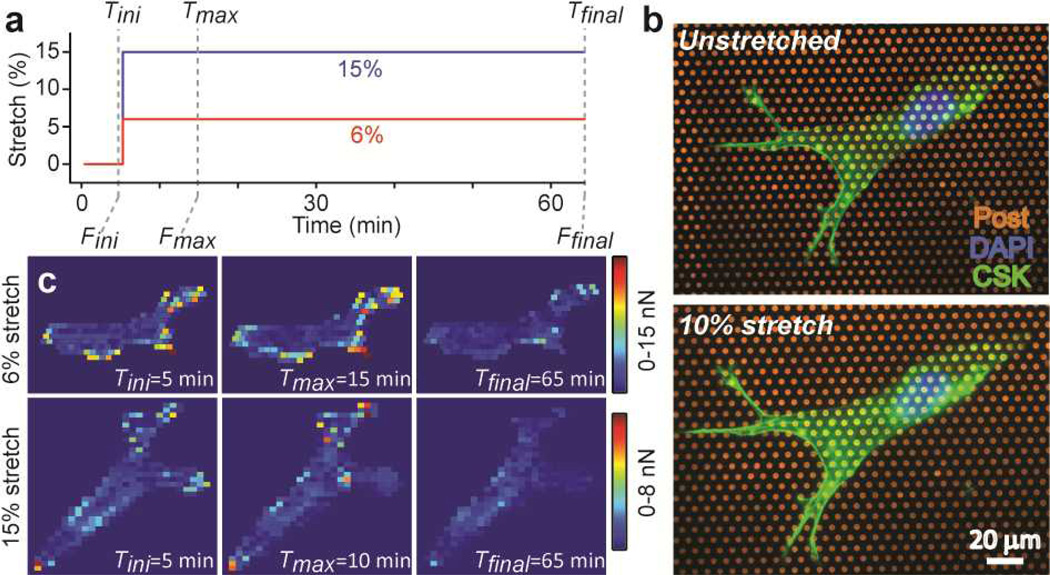
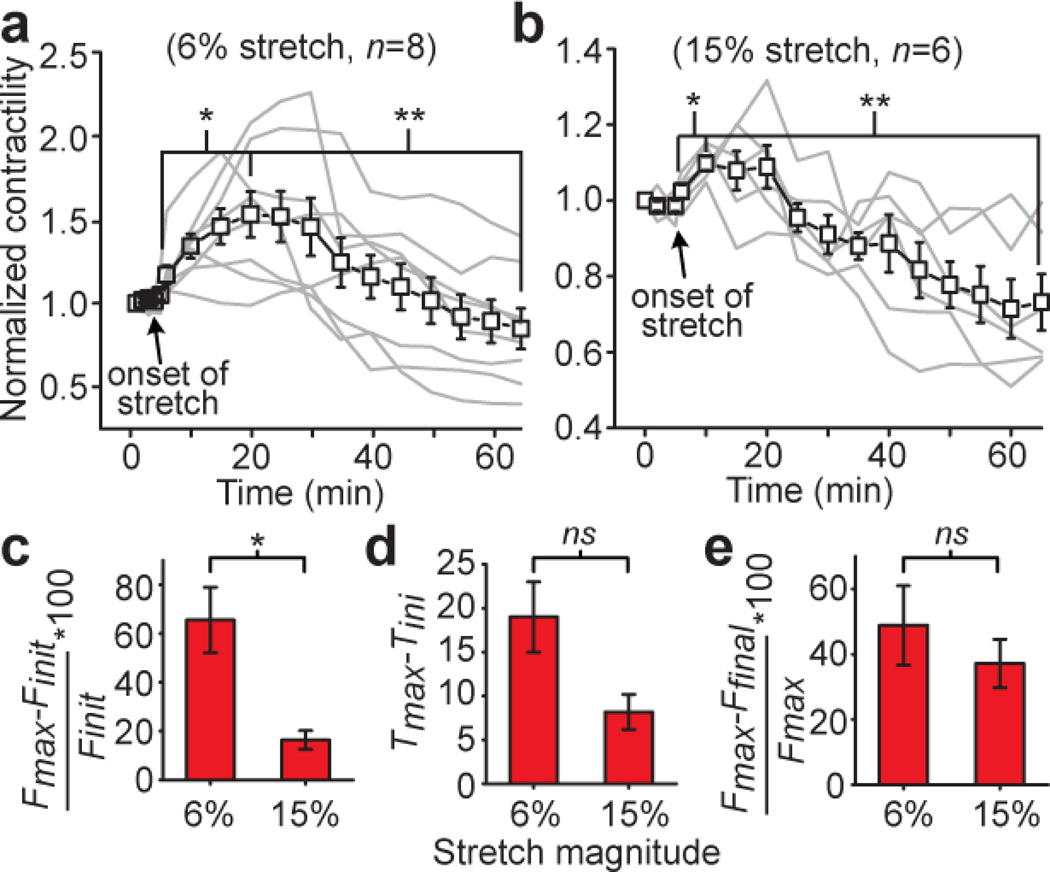
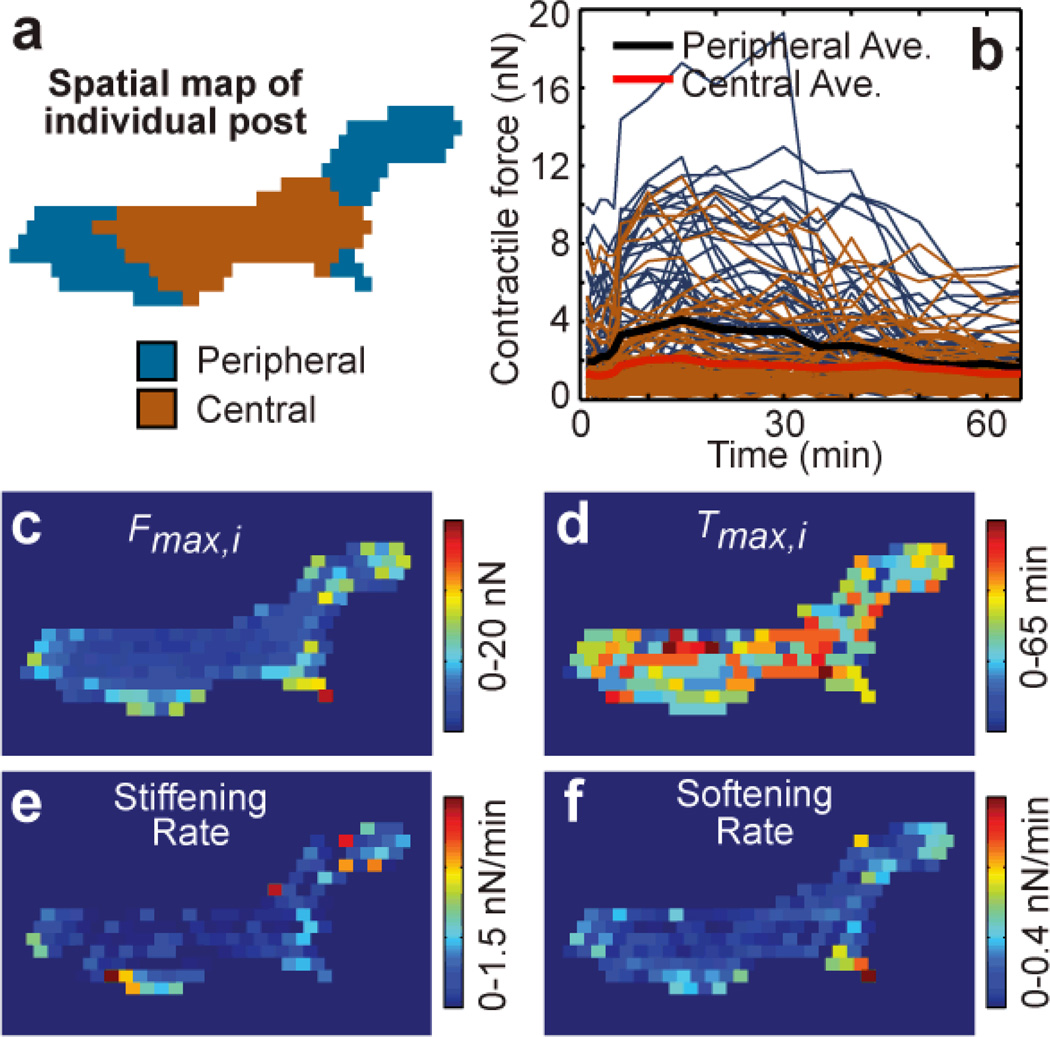
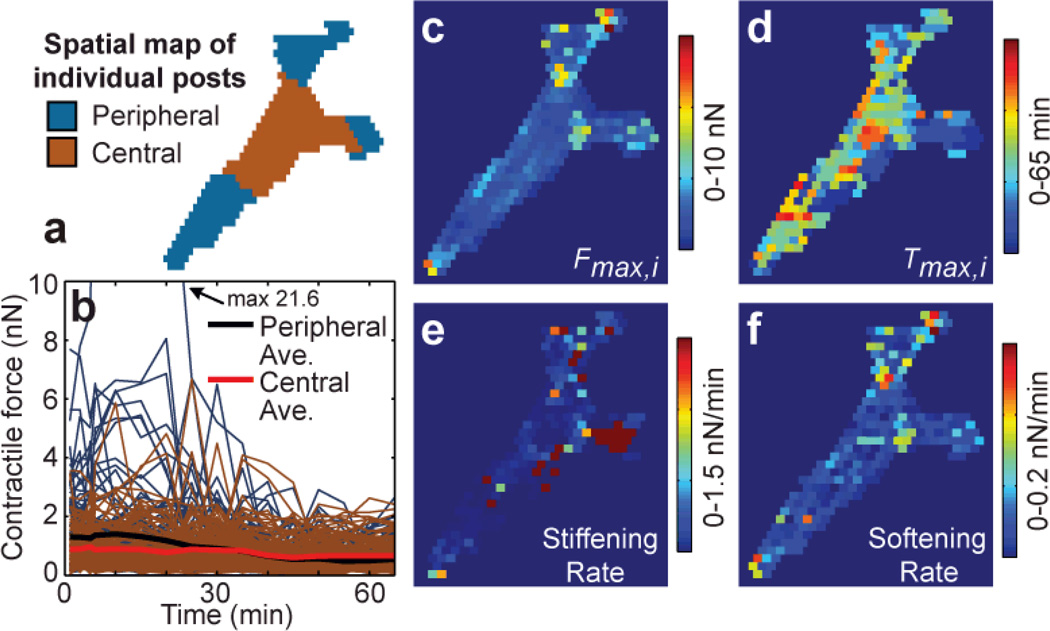
External forces are increasingly recognized as major regulators of cellular structure and function, yet the underlying mechanism by which cells sense forces and transduce them into intracellular biochemical signals and behavioral responses ('mechanotransduction') is largely undetermined. To aid in the mechanistic study of mechanotransduction, herein we devised a cell stretching device that allowed for quantitative control and real-time measurement of mechanical stimuli and cellular biomechanical responses. Our strategy involved a microfabricated array of silicone elastomeric microposts integrated onto a stretchable elastomeric membrane. Using a computer-controlled vacuum, this micropost array membrane (mPAM) was activated to apply equibiaxial cell stretching forces to adherent cells attached to the microposts. Using the mPAM, we studied the live-cell subcellular dynamic responses of contractile forces in vascular smooth muscle cells (VSMCs) to a sustained static equibiaxial cell stretch. Our data showed that in response to a sustained cell stretch, VSMCs regulated their cytoskeletal (CSK) contractility in a biphasic manner: they first acutely enhanced their contraction to resist rapid cell deformation ('stiffening') before they allowed slow adaptive inelastic CSK reorganization to release their contractility ('softening'). The contractile response across entire single VSMCs was spatially inhomogeneous and force-dependent. Our mPAM device and live-cell subcellular contractile measurements will help elucidate the mechanotransductive system in VSMCs and thus contribute to our understanding of pressure-induced vascular disease processes.


Figures

Figure 1
Figure 1
A custom-designed cell stretching device (CSD) containing an elastomeric PDMS micropost array membrane (mPAM) to modulate equibiaxial cell stretch while simultaneously measuring real-time live-cell subcellular contractile response. (a) Schematic of the CSD (gray) with the mPAM (blue) affixed and single live cells attached on the mPAM (green, in a pink cell medium). A vacuum could be drawn in the evacuation chamber which the PDMS base membrane was pulled into, thus evenly stretching the PDMS micropost array over the viewing aperture. The real-time mPAM stretching process and live-cell subcellular contractile response were observed through the glass bottom of the MatTek dish. (b) Three-dimensional view of the CSD. Note the square shaped PDMS micropost array was centered over the viewing aperture. (c) Bright-field images of unstretched (left) and equibiaxially stretched (right, 40%) PDMS micropost arrays. Note that the PDMS microposts were hexagonally spaced with the post c.t.c. distance increasing due to the mPAM stretch and the top surface of the PDMS microposts remained constant during the mPAM stretch. (d) Scanning electron microscopy (SEM) image of the PDMS microposts. Scale bar, 5 µm. (e) SEM of a single adherent cell attaching on the PDMS micropost tops. Note displacements of the micropost tops due to cellular contractile forces. Scale bar, 40 µm.
Figure 2
Figure 2
Experimental characterization of the equibiaxial mPAM stretch using the CSD. (a) Five different locations evenly distributed across the PDMS micropost array (blue) were chosen for characterizing the equibiaxial mPAM stretch. The PDMS microposts were stained with DiI for visualization of the PDMS microposts. The vacuum was modulated to apply 0%, 5%, 10%, and 20% static equibiaxial mPAM stretches. (b) Center-to-center (c.t.c.) distances of adjacent PDMS microposts under 0% (∎), 5% (●), 10% (▲), and 20% (▼) static mPAM stretches at the five different locations as indicated in a. (c) Diameters of the PDMS micropost tops measured from the fluorescent images shown in a, with the mPAM equibiaxially stretched under different stretch magnitudes as indicated. (d) Reliability test of the mPAM showing that under a constant vacuum, stable static mPAM stretches (with the stretch magnitude ranging from 0% to 20%) were achieved over a time period of at least 1 hr, with the c.t.c. distance of the adjacent PDMS microposts remaining constant over the whole stretching period.
Figure 3
Figure 3
Numerical analysis of mechanics of the PDMS micropost on the mPAM using the finite-element method (FEM). (a) Graphical depiction of FEM analysis of the PDMS microposts of different heights (L) each bending in response to applied horizontal traction force (F) of 20 nN, with the underlying PDMS base membranes unstretched (top panel) or equibiaxially stretched (bottom panel; 25%). Color scale indicates volumetric strain (unitless). (b) Deflection δ of the top surface of the micropost plotted as a function of traction force F, as calculated by FEM analysis, for PDMS microposts of different lengths and on both unstretched (large open symbols) and equibiaxially stretched (small solid symbols; 25% stretch) mPAMs. (c) Nominal spring constant (K) of the PDMS micropost as a function of L, as computed from FEM analysis (bars; green for microposts on unstretched mPAMs and blue for microposts on stretched ones) and from the Euler-Bernoulli beam theory (red curve).
Figure 4
Figure 4
Temporal progression of mPAM stretch and single-cell observation. (a) Schematic showing temporal regulation of static mPAM stretches. Each single live VSMC was continuously monitored for 5 min prior to mPAM stretch to obtain their baseline contractility Fini prior to stretch. At the onset of stretch when Tini = 5 min, a rapid step increase of static mPAM stretch (either 6% or 15%) was applied to the cell, and the static mPAM stretch was held constant for another 60 min (Tfinal = 65 min). Tmax indicates the time point when the cell could reach its maximum reactive contractility of Fmax. Ffinal indicates the cell contractile force at Tfinal = 65 min. (b) Representative fluorescent images showing single VSMCs on unstretched (top) and 10% stretched (bottom) mPAMs. VSMCs were stained with DAPI, fluorophore-labeled phalloidin and DiI to visualize nuclei, actin filaments, and underlying PDMS posts, respectively. (c) Colorimetric maps showing subcellular contractile force distributions for single VSMCs at Tini, Tmax, and Tfinal during 6% (top panel) and 15% (bottom panel) static mPAM stretches.
Figure 5
Figure 5
Real-time live-cell contractile response of single VSMCs to static mPAM stretches. (a&b) Evolution of cellular contractility (normalized to baseline contractility prior to stretch) for individual cells (gray lines) and population means (black lines with marker symbols) under different stretch conditions as indicated (a: 6% stretch; b: 15% stretch). Cellular contractility of all cells was followed at 5 min intervals for the whole period of stretch assays. Each cell was exposed to the mPAM stretch once to avoid their potential adaptive response to multiple stretches. Error bars indicate ± standard errors (SE) of the cell populations. P-values calculated using the paired student’s t-test are indicated for statistically significant differences (P < 0.05 (*) and P < 0.005 (**)). (c) Bar graph showing the relative maximum increase of cellular contractility, calculated as (FmaxFini) / Fini × 100, as a function of stretch magnitude. (d) Bar graph showing the time needed for individual VSMCs to reach their maximum reactive contractile forces after the onset of the mPAM stretch, or TmaxTini, as a function of stretch magnitude. ns, statistically not significant. (e) Bar graph showing the relative decrease of cellular contractility from Tmax to Tfinal, calculated as (FmaxFfinal) / Fmax × 100, as a function of stretch magnitude.
Figure 6
Figure 6
Subcellular analysis of the biphasic contractile response of single VSMCs to the 6% static mPAM stretch. (a) Spatial map of the individual PDMS microposts underneath the VSMC. The microposts were labeled with different colors to indicate their distances from the cell’s geometric centroid (blue: microposts at the cell periphery; gold: microposts in the cell’s central region). (b) Evolution of contractile forces exerted on the individual PDMS microposts underneath the VSMC tracked throughout the whole stretch assay. Blue curves were from PDMS microposts at the cell periphery and gold curves were from the PDMS microposts at the central region of the cell. The bold black curve corresponded to the peripheral population mean and the bold red line corresponded to the central population mean. (c) Colorimetric map showing the spatial distribution and magnitude of the maximum reactive contractile forces exerted on the hexagonally arranged PDMS microposts (Fmax,i) developed during the whole stretch assay. (d) Colorimetric map showing the spatial distribution and magnitude of the time required for individual PDMS microposts (Tmax,i) to reach Fmax,i. (e&f) Colorimetric map showing the spatial distribution of increasing (e) and decreasing (f) rates of reactive contractile forces for individual PDMS microposts during the stiffening and softening phases, respectively. Increasing rate of reactive contractile forces during the stiffening phase was defined as (Fmax,iFini,i) / (Tmax,iTini), while decreasing rate of reactive contractile forces during the softening phase as (Fmax,iFfinal,i) / (TfinalTmax,i).
Figure 7
Figure 7
Subcellular analysis of the biphasic contractile response of single VSMCs to the 15% static mPAM stretch. (a) Spatial map of the individual PDMS microposts underneath the VSMC. The microposts were labeled with different colors to indicate their distances to the cell periphery (blue: microposts at the cell periphery; gold: microposts in the cell’s central region). (b) Evolution of contractile forces exerted on the individual PDMS microposts underneath the VSMC tracked throughout the whole stretch assay. Blue curves were from PDMS microposts at the cell periphery and gold curves from the PDMS microposts at the center region of the cell. The bold black curve corresponded to the peripheral population mean and the bold red line corresponded to the central population mean. The numerical data in the plot indicates the maximum value that the outlier curves reached outside the plot window. (c) Colorimetric map showing the spatial distribution and magnitude of the maximum reactive contractile forces exerted on the hexagonally arranged PDMS microposts (Fmax,i) developed during the whole stretch assay. (d) Colorimetric map showing the spatial distribution and magnitude of the time required for individual PDMS microposts (Tmax,i) to reach Fmax,i. (e&f) Colorimetric map showing the spatial distribution of increasing (e) and decreasing (f) rates of reactive contractile forces for individual PDMS microposts during the stiffening and softening phases, respectively. Increasing rate of reactive contractile forces during the stiffening phase was defined as (Fmax,iFini,i) / (Tmax,iTini), while decreasing rate of reactive contractile forces during the softening phase as (Fmax,iFfinal,i) / (TfinalTmax,i).

References

    1. Geiger B, Bershadsky A, Pankov R, Yamada KM. Nature Reviews Molecular Cell Biology. 2001;2:793–805. - PubMed
    1. Orr AW, Helmke BP, Blackman BR, Schwartz MA. Developmental Cell. 2006;10:11–20. - PubMed
    1. Vogel V, Sheetz M. Nature Reviews Molecular Cell Biology. 2006;7:265–275. - PubMed
    1. Geiger B, Spatz JP, Bershadsky AD. Nature Reviews Molecular Cell Biology. 2009;10:21–33. - PubMed
    1. Hoffman BD, Grashoff C, Schwartz MA. Nature. 2011;475:316–323. - PMC - PubMed

Publication types

MeSH terms