

Consensus versus disagreement in imaging research: a case study using the LIDC database
- PMID: 22193755
- PMCID: PMC3348979
- DOI: 10.1007/s10278-011-9445-3
Consensus versus disagreement in imaging research: a case study using the LIDC database
Abstract
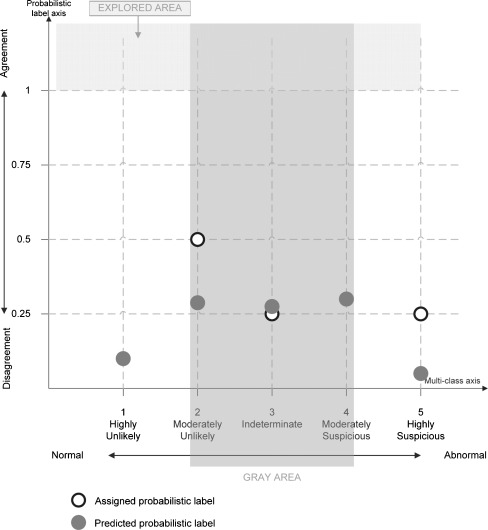
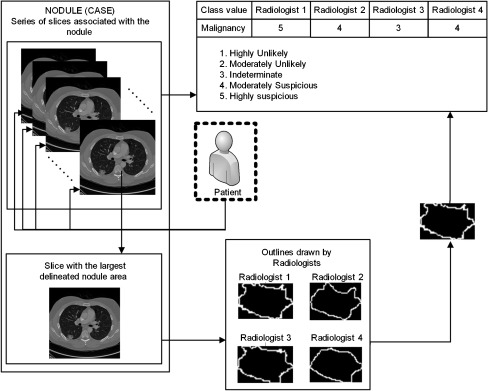
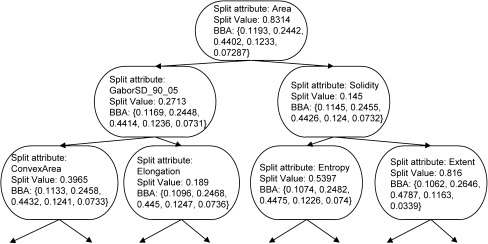
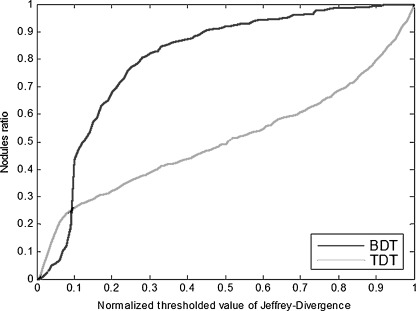
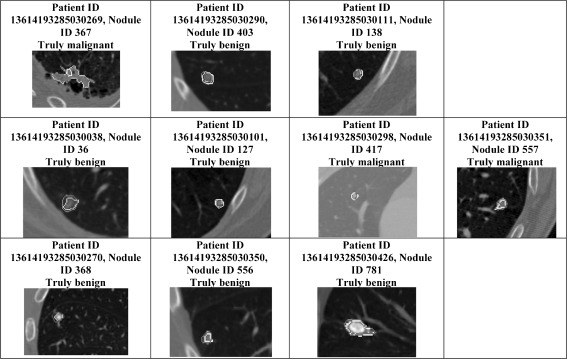
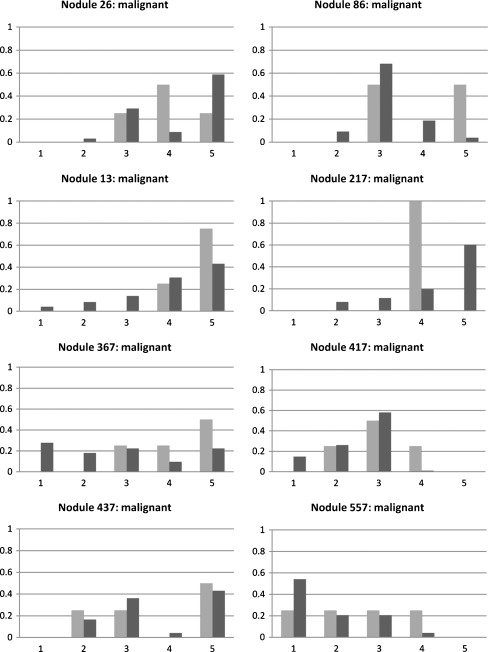
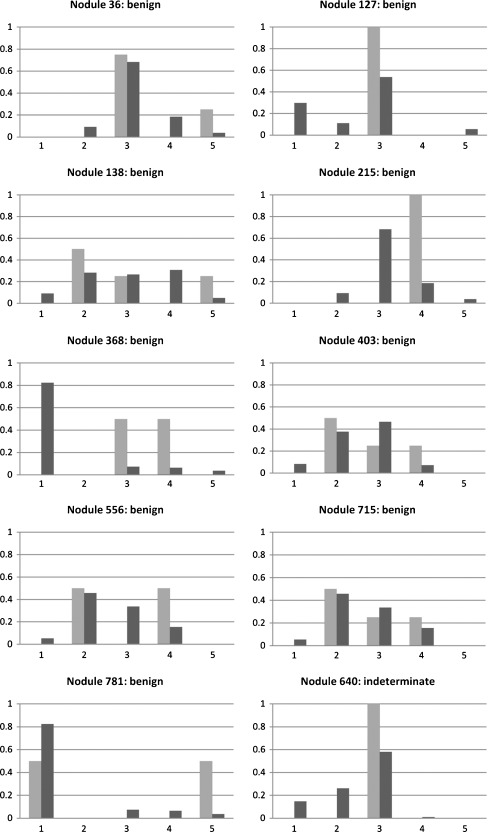
Traditionally, image studies evaluating the effectiveness of computer-aided diagnosis (CAD) use a single label from a medical expert compared with a single label produced by CAD. The purpose of this research is to present a CAD system based on Belief Decision Tree classification algorithm, capable of learning from probabilistic input (based on intra-reader variability) and providing probabilistic output. We compared our approach against a traditional decision tree approach with respect to a traditional performance metric (accuracy) and a probabilistic one (area under the distance-threshold curve-AuC(dt)). The probabilistic classification technique showed notable performance improvement in comparison with the traditional one with respect to both evaluation metrics. Specifically, when applying cross-validation technique on the training subset of instances, boosts of 28.26% and 30.28% were noted for the probabilistic approach with respect to accuracy and AuC(dt), respectively. Furthermore, on the validation subset of instances, boosts of 20.64% and 23.21% were noted again for the probabilistic approach with respect to the same two metrics. In addition, we compared our CAD system results with diagnostic data available for a small subset of the Lung Image Database Consortium database. We discovered that when our CAD system errs, it generally does so with low confidence. Predictions produced by the system also agree with diagnoses of truly benign nodules more often than radiologists, offering the possibility of reducing the false positives.
Figures
Similar articles
-
Probabilistic lung nodule classification with belief decision trees.Annu Int Conf IEEE Eng Med Biol Soc. 2011;2011:4493-8. doi: 10.1109/IEMBS.2011.6091114. Annu Int Conf IEEE Eng Med Biol Soc. 2011. PMID: 22255337
-
A new computationally efficient CAD system for pulmonary nodule detection in CT imagery.Med Image Anal. 2010 Jun;14(3):390-406. doi: 10.1016/j.media.2010.02.004. Epub 2010 Feb 19. Med Image Anal. 2010. PMID: 20346728
-
Computer-aided detection of pulmonary nodules: a comparative study using the public LIDC/IDRI database.Eur Radiol. 2016 Jul;26(7):2139-47. doi: 10.1007/s00330-015-4030-7. Epub 2015 Oct 6. Eur Radiol. 2016. PMID: 26443601 Free PMC article.
-
Computer-aided diagnosis and artificial intelligence in clinical imaging.Semin Nucl Med. 2011 Nov;41(6):449-62. doi: 10.1053/j.semnuclmed.2011.06.004. Semin Nucl Med. 2011. PMID: 21978447 Review.
-
Research progress of computer aided diagnosis system for pulmonary nodules in CT images.J Xray Sci Technol. 2020;28(1):1-16. doi: 10.3233/XST-190581. J Xray Sci Technol. 2020. PMID: 31815727 Review.
Cited by
-
A method for evaluating the performance of computer-aided detection of pulmonary nodules in lung cancer CT screening: detection limit for nodule size and density.Br J Radiol. 2017 Feb;90(1070):20160313. doi: 10.1259/bjr.20160313. Epub 2017 Jan 3. Br J Radiol. 2017. PMID: 27897029 Free PMC article.
References
-
- Turner DA. Observer variability: what to do until perfect diagnostic tests are invented. J Nucl Med. 1978;19(4):435–437. - PubMed
MeSH terms
LinkOut - more resources
Full Text Sources
Medical
Miscellaneous
