Comparative Study
. 2012 Mar;78(5):1523-33.
doi: 10.1128/AEM.06826-11. Epub 2011 Dec 22.

Accurate, rapid taxonomic classification of fungal large-subunit rRNA genes

Affiliations
Comparative Study

Accurate, rapid taxonomic classification of fungal large-subunit rRNA genes

Kuan-Liang Liu et al. Appl Environ Microbiol. 2012 Mar.

Abstract

Taxonomic and phylogenetic fingerprinting based on sequence analysis of gene fragments from the large-subunit rRNA (LSU) gene or the internal transcribed spacer (ITS) region is becoming an integral part of fungal classification. The lack of an accurate and robust classification tool trained by a validated sequence database for taxonomic placement of fungal LSU genes is a severe limitation in taxonomic analysis of fungal isolates or large data sets obtained from environmental surveys. Using a hand-curated set of 8,506 fungal LSU gene fragments, we determined the performance characteristics of a naïve Bayesian classifier across multiple taxonomic levels and compared the classifier performance to that of a sequence similarity-based (BLASTN) approach. The naïve Bayesian classifier was computationally more rapid (>460-fold with our system) than the BLASTN approach, and it provided equal or superior classification accuracy. Classifier accuracies were compared using sequence fragments of 100 bp and 400 bp and two different PCR primer anchor points to mimic sequence read lengths commonly obtained using current high-throughput sequencing technologies. Accuracy was higher with 400-bp sequence reads than with 100-bp reads. It was also significantly affected by sequence location across the 1,400-bp test region. The highest accuracy was obtained across either the D1 or D2 variable region. The naïve Bayesian classifier provides an effective and rapid means to classify fungal LSU sequences from large environmental surveys. The training set and tool are publicly available through the Ribosomal Database Project.


Figures

Fig 1
Fig 1
Sequence coverage in the training set across a 1,400-bp region of the LSU gene, based on multiple sequence alignment with S. cerevisiae. The percent coverage is shown on the y axis, and the corresponding S. cerevisiae gene position is shown on the x axis. The gap regions of the alignment with less sequence coverage are shown as dropping lines. The D1 and D2 hypervariable regions are shaded, and the locations of the LR0R (bp 26 to 42) and LR3 (bp 635 to 651) primers on the alignment are labeled.
Fig 2
Fig 2
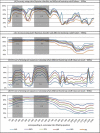
Entropy across the 1,400-bp LSU gene region. The Shannon entropy index (H′) was calculated for each 100-bp (A) and 400-bp (B) tiled sequence fragment, and the mean information entropy for k-mer-sized windows along the length of the sequence was plotted at the midpoint of each sliding window. The gray shading in each panel indicates the locations of the D1 (bp 127 to 264) and D2 (bp 423 to 636) hypervariable regions. The corresponding S. cerevisiae LSU gene bp is shown on the x axis. Entropy percentages are shown on the y axis. Colored boxes represent word sizes from 1-mer to 15-mer.
Fig 3
Fig 3
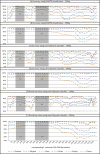
Classification accuracy and bootstrap confidence across the 1,400-bp LSU gene region. (A and B) Classification accuracies for the BLASTN LOOCV test with sequence segments of 100 bp (A) and 400 bp (B), moving 25 bases at a time. (C and D) Classification accuracies for the naïve Bayesian classifier LOOCV test with sequence segments of 100 bp (C) and 400 bp (D), moving 25 bases at a time. (E and F) Average bootstrap confidence estimate for each 100-bp (E) and 400-bp (F) sequence fragment, using the naïve Bayesian classifier. The gray shading in each panel indicates the locations of the D1 (bp 127 to 264) and D2 (bp 423 to 636) hypervariable regions. The corresponding S. cerevisiae LSU gene bp position is shown on the x axis. Each y axis shows percentages relevant to the panel title, and values are plotted at the midpoint of each sliding window. Colored dashed lines in panels A to F represent different taxonomic levels.
Fig 4
Fig 4
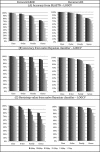
Classification accuracy by query sequence length and primer position for LOOCV testing using the naïve Bayesian classifier and BLASTN approaches. Numbers are percentages of correctly classified query sequences. (A) Accuracy using BLASTN; (B) accuracy using naïve Bayesian classifier; (C) average bootstrap value obtained using naïve Bayesian classifier. The y axis for each panel shows percentages relevant to the panel title.
Fig 5
Fig 5
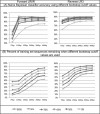
Different bootstrap cutoffs across the 1,400-bp LSU gene region. (A and B) Classification accuracies obtained with sequence segments of 100 bp (A) and 400 bp (B) when different bootstrap cutoffs are used. (C and D) Percentages of remaining 100-bp (C) and 400-bp (D) tiled sequences when different bootstrap cutoffs are used. The gray shading in each panel indicates the locations of the D1 (bp 127 to 264) and D2 (bp 423 to 636) hypervariable regions. The corresponding S. cerevisiae LSU gene bp position is shown on the x axis. Each y axis shows percentages relevant to the panel title, and the values are plotted at the midpoint of each sliding window. Colored solid lines in panels A to D represent bootstrap cutoff values.
Fig 6
Fig 6
(A) Naïve Bayesian classifier accuracies obtained using different bootstrap cutoff values. (B) Percentages of training set sequences remaining when different bootstrap cutoff values are used. Each y axis shows percentages relevant to the panel title.

References

    1. Arnold AE, et al. 2009. A phylogenetic estimation of trophic transition networks for ascomycetous fungi: are lichens cradles of symbiotrophic fungal diversification? Syst. Biol. 58:283–297 - PubMed
    1. Blackwell M. 2011. The fungi: 1, 2, 3 … 5.1 million species? Am. J. Bot. 98:426–438 - PubMed
    1. Blackwell M, Hibbett DS, Taylor JW, Spatafora JW. 2006. Research coordination networks: a phylogeny for kingdom Fungi (deep hypha). Mycologia 98:829–837 - PubMed
    1. Buee M, et al. 2009. 454 pyrosequencing analyses of forest soils reveal an unexpectedly high fungal diversity. New Phytol. 184:449–456 - PubMed
    1. Camacho C, et al. 2009. BLAST+: architecture and applications. BMC Bioinformatics 10:421. - PMC - PubMed

Publication types