Case Reports
. 2011 Mar-Jun;15(1):57-76.
doi: 10.1177/1084713811420304.

The University of Western Ontario Pediatric Audiological Monitoring Protocol (UWO PedAMP)

Affiliations
Case Reports

The University of Western Ontario Pediatric Audiological Monitoring Protocol (UWO PedAMP)

Marlene P Bagatto et al. Trends Amplif. 2011 Mar-Jun.

Abstract

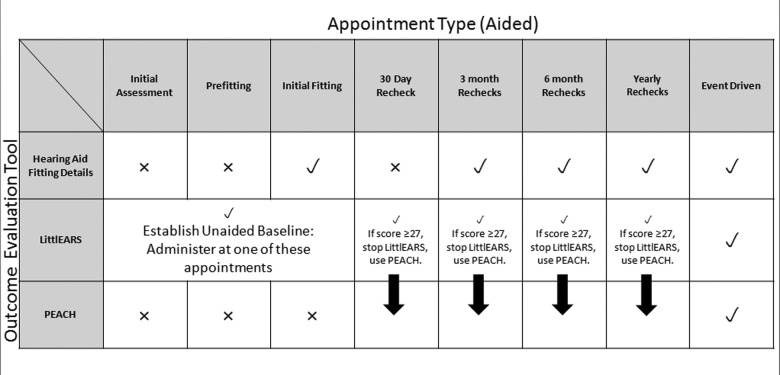
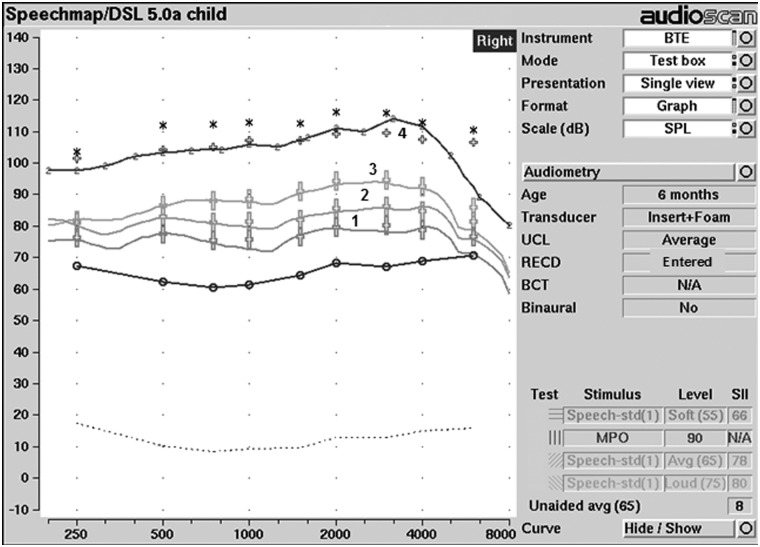
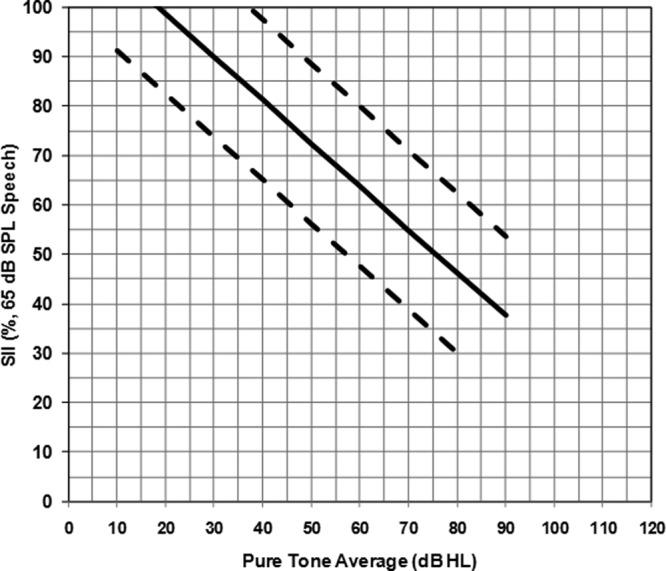
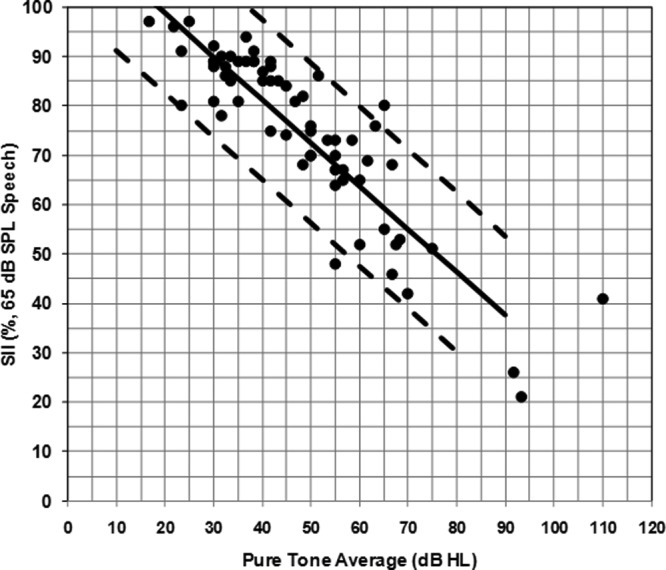
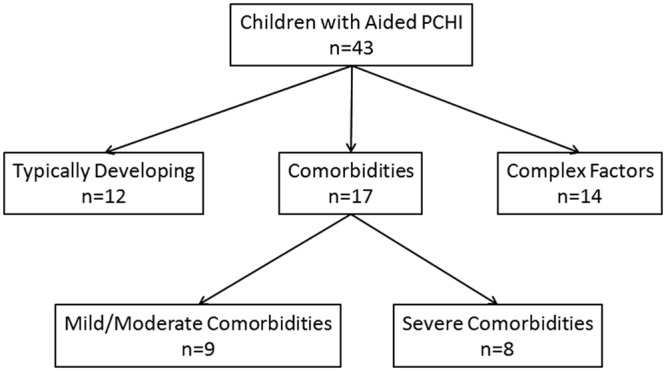
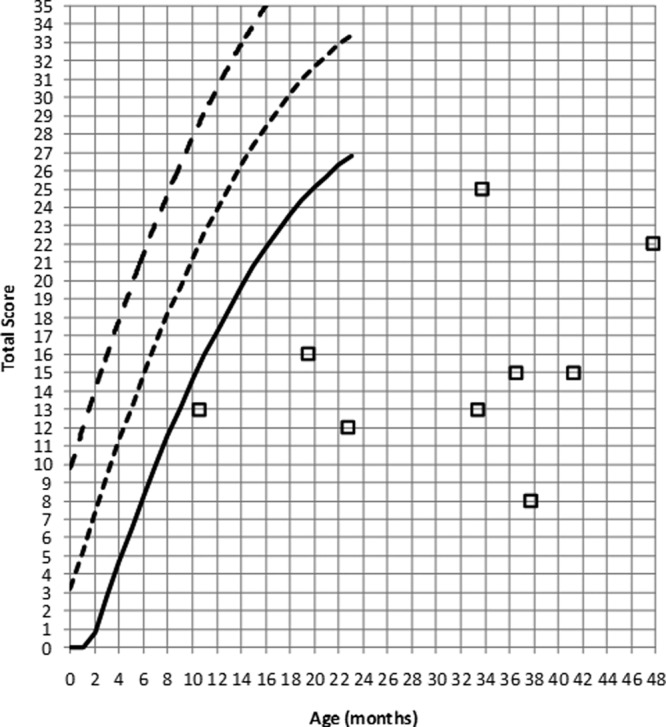
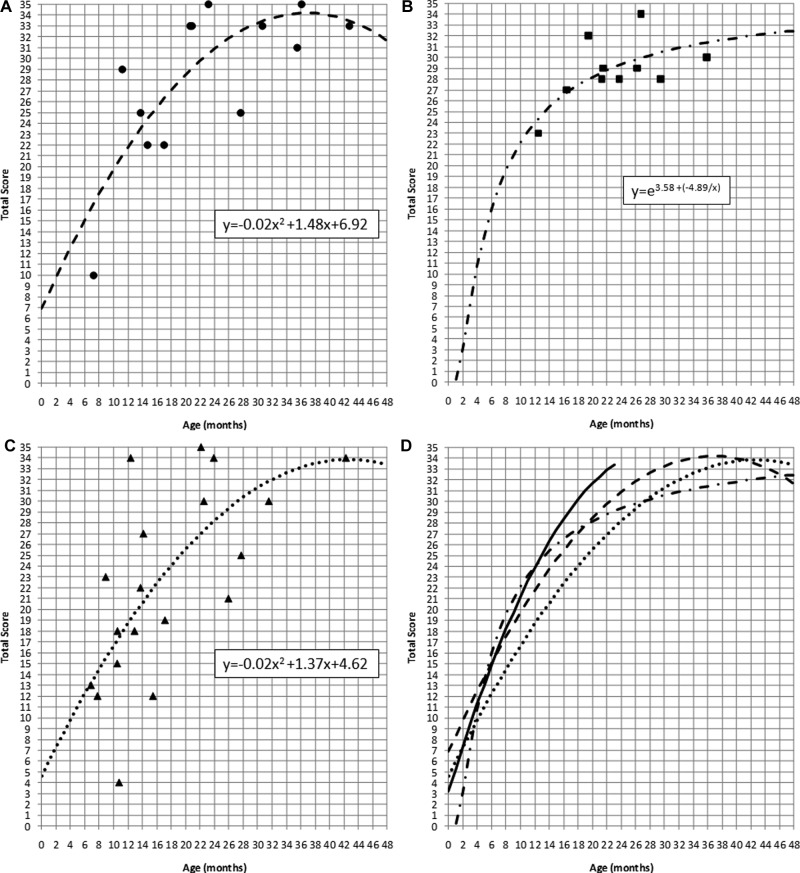
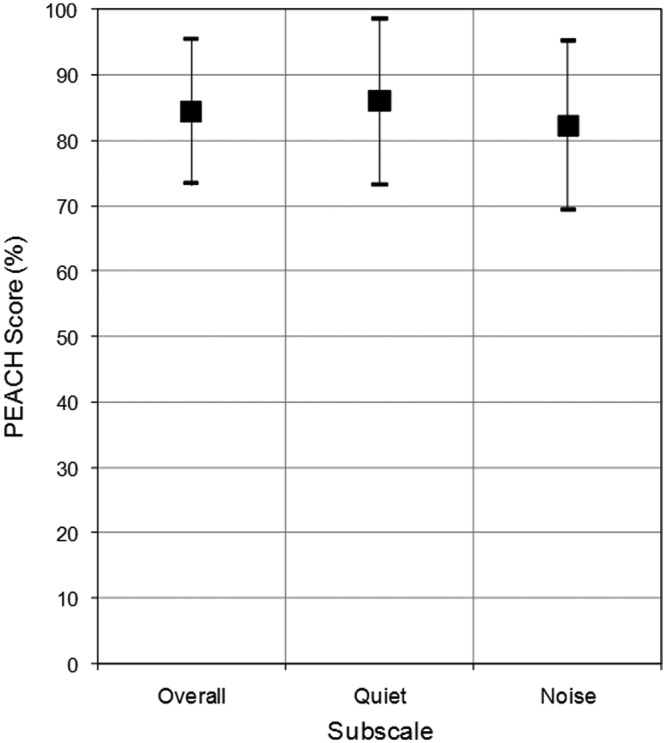
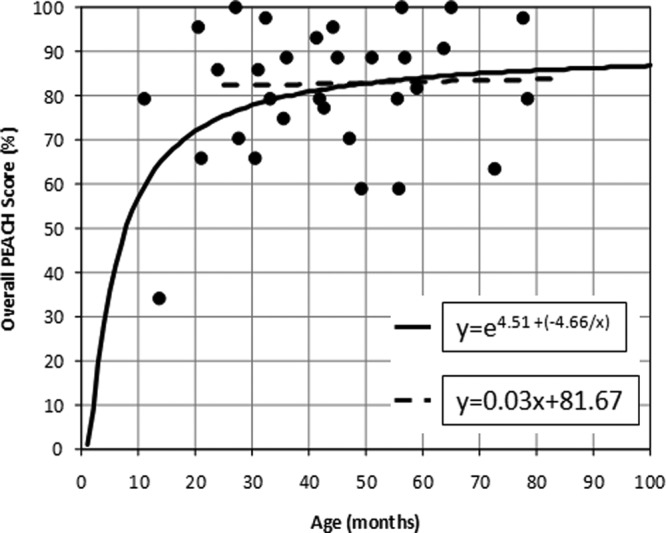
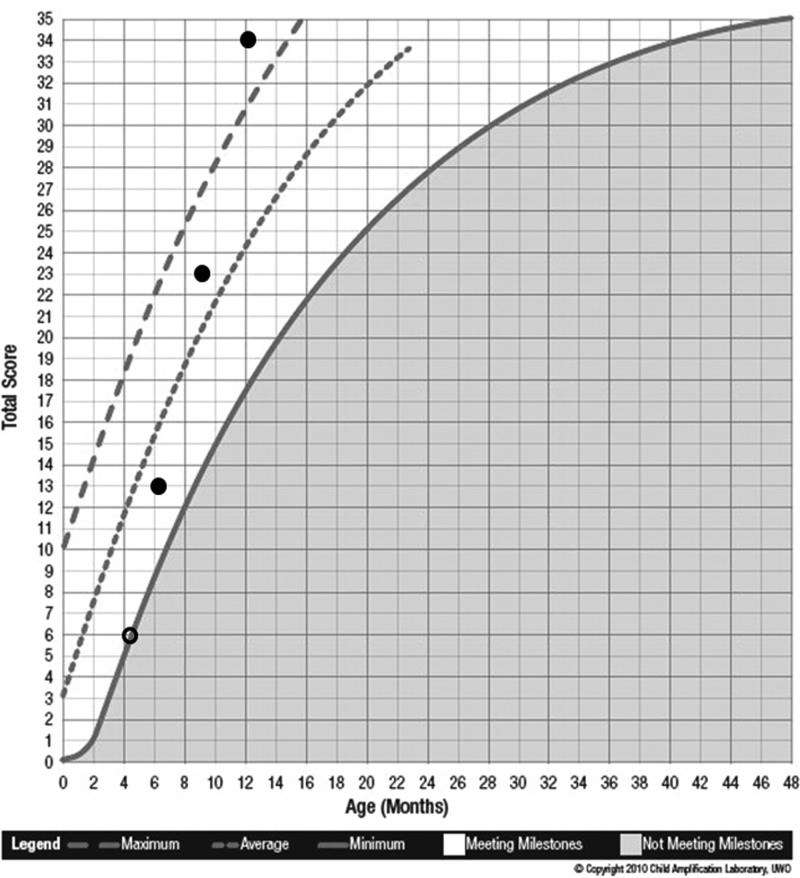
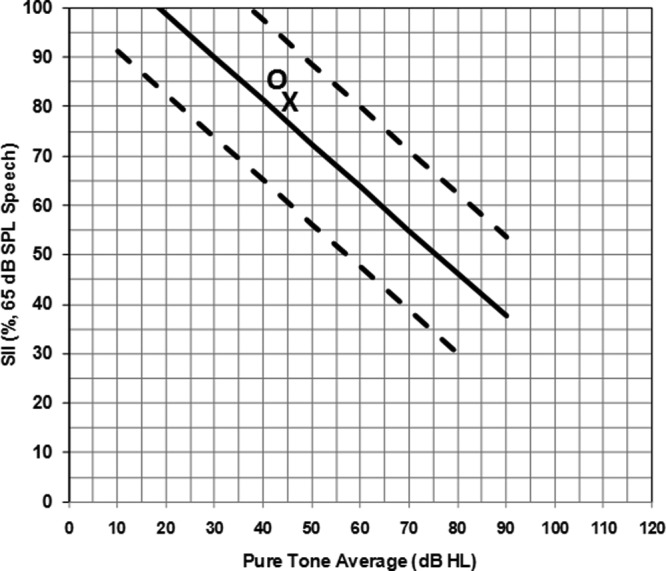
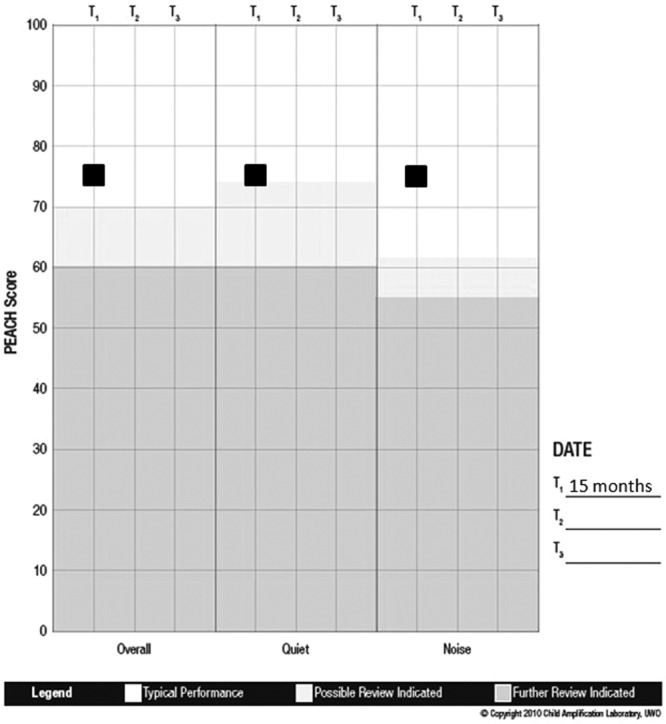
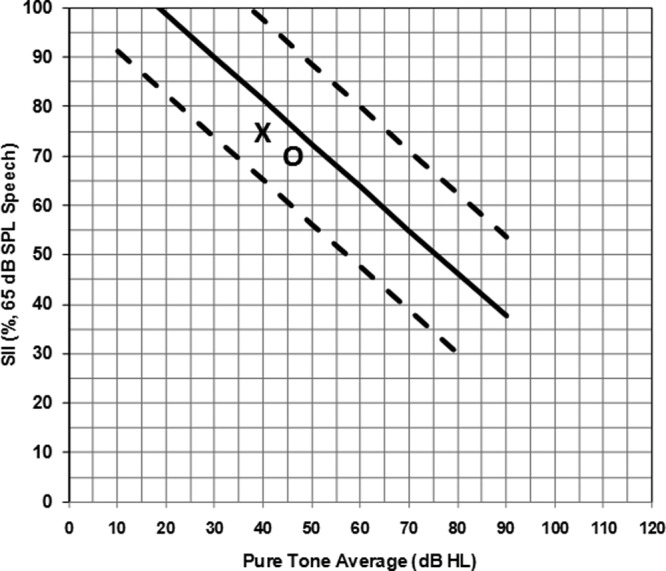
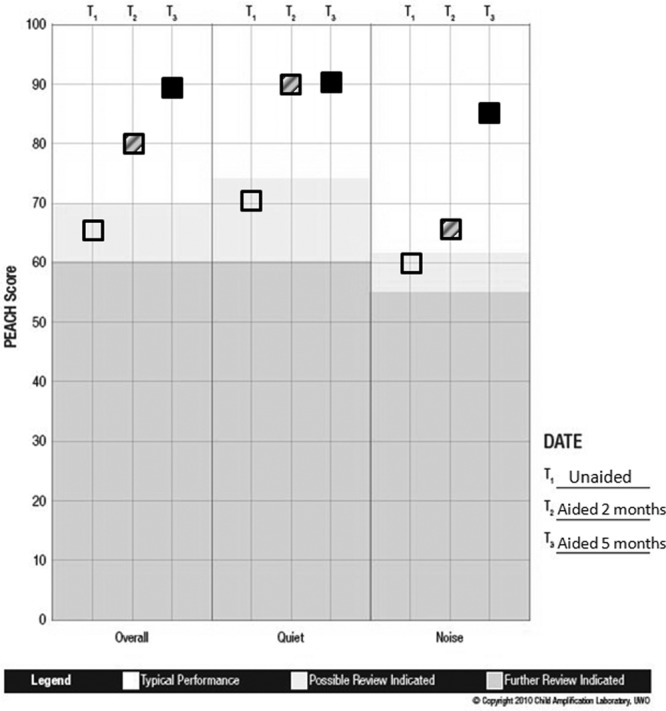
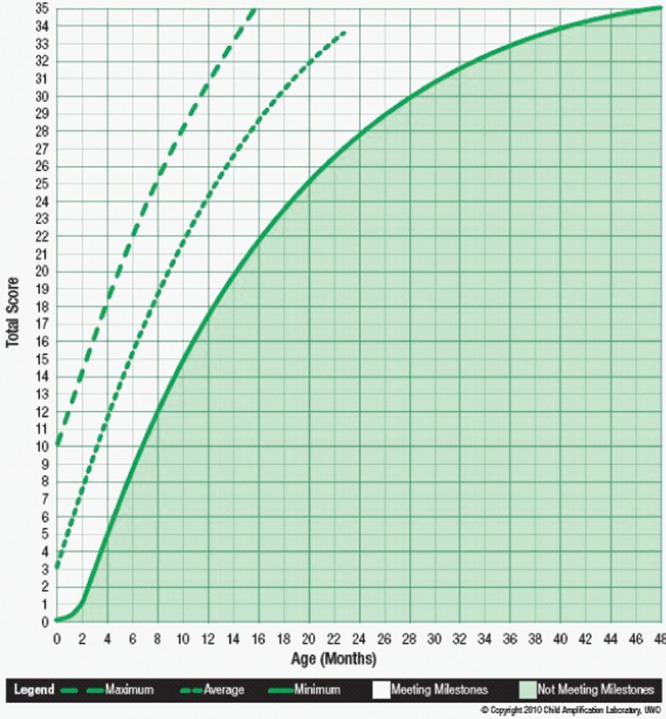
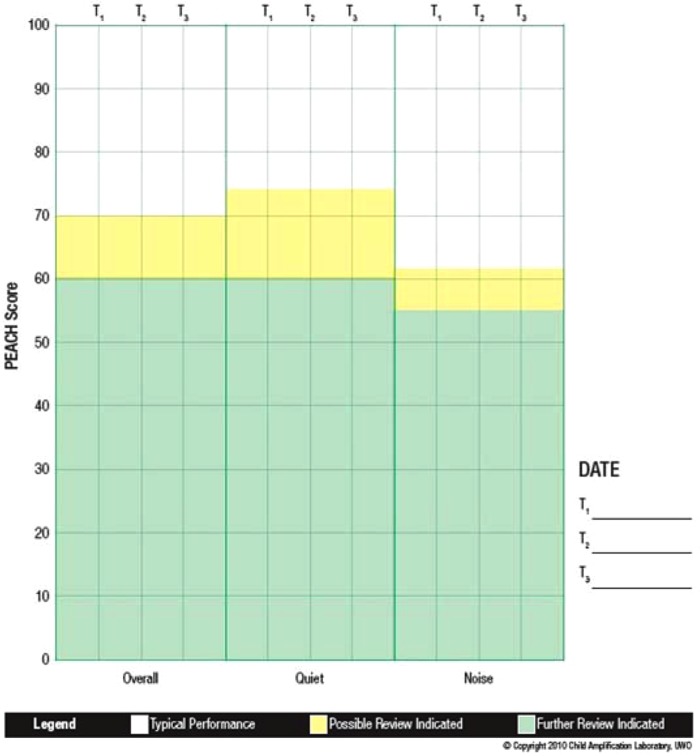
This study proposed and evaluated a guideline for outcome evaluation for infants and children with hearing loss who wear hearing aids. The University of Western Ontario Pediatric Audiological Monitoring Protocol (UWO PedAMP) was developed following a critical review of pediatric outcome evaluation tools and was systematically examined by the Network of Pediatric Audiologists of Canada. It consists of tools to gather clinical process outcomes as well as functional caregiver reports. The UWO PedAMP was administered to a clinical population of infants and children with hearing aids. Sixty-eight children were administered the functional outcome evaluation tools (i.e., caregiver reports) a total of 133 times. Clinical process outcomes of hearing aid verification (e.g., real-ear-to-coupler difference) revealed typical aided audibility (e.g., Speech Intelligibility Index). Results for the LittlEARS(®) questionnaire revealed that typically developing children with hearing loss who wear hearing aids are meeting auditory development milestones. Children with mild to moderate comorbidities displayed typical auditory development during the 1st year of life after which development began to decline. Children with complex factors related to hearing aid use had lower scores on the LittlEARS, but auditory development was in parallel to norms. Parents' Evaluation of Aural/Oral Performance (PEACH) results indicated no age effect on scoring for children above 2 years of age; however, the effect of degree of hearing loss was significant. This work provides clinicians with a systematic, evidence-based outcome evaluation protocol to implement as part of a complete pediatric hearing aid fitting.


Conflict of interest statement

Declaration of Conflicting Interests: The authors declared no potential conflicts of interest with respect to the research, authorship, and/or publication of this article.

Figures

Figure 1.
Figure 1.
Administration guidelines for children with PCHI who wear hearing aids Note: The top row specifies the appointment type and the far left column indicates the outcome evaluation tool within the UWO PedAMP that should be administered. Within the grid, “✓” and “X” designates when an outcome evaluation tool should or should not be administered at a particular appointment.
Figure 2
Figure 2
SPLogram display of hearing instrument performance in relation to pediatric DSL v5.0a targets for a child with a PTA of 52 dB HL Note: The solid lines represent the output of the hearing instrument for soft (1), average (2), loud (3) speech inputs and MPO (4) in relation to the various speech targets (large +) and MPO targets (small +). Thresholds (o) and upper limits of comfort (*) are also displayed.
Figure 3.
Figure 3.
Graph from the Aided SII Normative Values Worksheet displaying SII values for a 65 dB speech input Note: The regression line was obtained from hearing aid fittings on 161 ears of infants and children. The solid line represents the linear fit to the data and the dashed lines represent the upper and lower 95% confidence interval ranges. An SII value that falls between the dashed lines is considered to be typical audibility for that pure tone average.
Figure 4.
Figure 4.
SII values for average speech inputs by PTA for children with hearing aids involved in this study (filled circles) Note: Solid and dashed lines are from the Aided SII Normative Values Worksheet. The solid line is the average SII normative values and the dashed lines are the upper and lower 95% confidence interval ranges.
Figure 5.
Figure 5.
Subgroup flowchart for children with hearing aids whose caregivers were administered the LittlEARS Auditory Questionnaire Note: Of the total sample with hearing aids, these children were grouped into those with typical development, comorbidities, and complex factors.
Figure 6.
Figure 6.
LittlEARS scores from children with hearing aids who were born full-term and have severe comorbidities Note: The solid line indicates the minimum expected score, the small dashed line indicates the average expected score and the large dashed line indicates the maximum expected score from the German-derived norms. Open squares indicate LittlEARS scores from children with PCHI who have severe comorbidities in this sample. Children with scores above the solid line are considered to be meeting auditory development milestones for their age and children with scores below the solid line are considered to not be meeting milestones.
Figure 7.
Figure 7.
LittlEARS scores (y-axis) by age (x-axis) and regression lines from children with hearing aids who (a) are typically developing and have no comorbidities or complex factors (filled circles); (b) have mild to moderate comorbidities (filled squares); and (c) have complex factors (filled triangles) Note: The various lines indicate the regression for each set of data: (a) large dashed; (b) dotted-dashed; and (c) small dashed. Regression equations are noted within each figure. The fourth panel (7d) displays all regression lines on a single graph and compares them to the average normative values (solid line).
Figure 8.
Figure 8.
PEACH scores from typically developing, full-term children with hearing aids Note: Squares represent average percentage scores for each subscale and vertical bars represent the standard deviation around the mean. Note that all scores are within the “Typical Performance” (nonshaded) range for this sample of children.
Figure 9.
Figure 9.
PEACH scores (y-axis) by age (x-axis) and regression lines from typically developing children (filled circles) with hearing aids Note: The solid line is an s-shaped regression for typically developing children of all ages involved in this study. A nonsignificant linear regression is shown with the dashed line for typically developing children over the age of 24 months. Regression equations are noted in the figure.
Figure 10.
Figure 10.
LittlEARS score sheet for case example: Michael Note: The solid line indicates the minimum expected score, the small dashed line indicates the average expected score and the large dashed line indicates the maximum expected score from the German-derived norms. Circles represent the LittlEARS Score (y-axis) plotted by the child’s age in months (x-axis). The open circle is the unaided score and the filled circles represent scores in the aided condition. Scores in the nonshaded region indicate the child is meeting auditory development milestones for his age and scores in the shaded region indicate the child is not meeting auditory development milestones for his age. Michael was meeting minimum auditory development milestones for his age prior to being fitted with amplification. While wearing the hearing aids, Michael’s scores improved to where he was showing progress and meeting auditory development milestones for his age.
Figure 11.
Figure 11.
Aided SII values for case example: Michael Note: SII values (y-axis) for an average speech input are plotted for the right (O) and left (X) hearing aid fittings by Michael’s PTA (x-axis). Since the symbols fall within the 95% confidence intervals (dashed lines), it can be concluded that Michael’s hearing aid fitting is providing a typical degree of audibility for his degree of hearing loss, in both ears.
Figure 12.
Figure 12.
PEACH score sheet for case example: Michael Note: The PEACH percentage scores (y-axis) are plotted within each subscale (x-axis) for this case example. Results indicate that Michael is demonstrating typical auditory performance while wearing the hearing aids.
Figure 13.
Figure 13.
Aided SII values for case example: Emma Note: SII values (y-axis) for an average speech input are plotted for the right (O) and left (X) hearing aid fittings by Emma’s PTA (x-axis). Since the symbols fall within the 95% confidence intervals (dashed lines), it is concluded that Emma’s hearing aid fitting is providing a typical degree of audibility for her degree of hearing loss, in both ears.
Figure 14.
Figure 14.
PEACH score sheet for case example: Emma Note: The PEACH percentage scores (y-axis) are plotted within each subscale (x-axis) for this case example. Open squares indicate the unaided condition, hatched squares indicate 2 months of hearing aid use, and filled squares indicate 5 months of hearing aid use. Results indicate that prior to the use of hearing aids, Emma was demonstrating atypical auditory performance. As she gained experience with amplification, she demonstrated an improvement in auditory performance over time in all subscales.
None
(B) LittlEARS Score Sheet
None
(C) PEACH Score Sheet

References

    1. American Academy of Audiology. (2003, October). Pediatric amplification protocol. Retrieved August 18, 2011 from http://www.audiology.org/resources/documentlibrary/Documents/pedamp.pdf
    1. American National Standards Institute. (1997). Methods for the calculation of the Speech Intelligibility Index (ANSI S3.5–1997). New York, NY: Acoustical Society of America
    1. Andresen E. M. (2000). Criteria for assessing the tools of disability outcomes research. Archives of Physical Medicine & Rehabilitation, 81(Suppl. 2), S15-S20 - PubMed
    1. Bagatto M. P., Brown C. L., Moodie S. T., Scollie S. D. (2011). External validation of the LittlEARS® auditory questionnaire with English-speaking families of Canadian children with normal hearing. International Journal of Pediatric Otorhinolaryngology, 75, 815-817 - PubMed
    1. Bagatto M. P., Moodie S. T., Seewald R.C., Bartlett D. J., Scollie S.D. (2011). A critical review of audiological outcome measures for infants and children. Trends in Amplification. 2011, 15:1-2 - PMC - PubMed

MeSH terms