

Quantitative fiber tracking in the corpus callosum and internal capsule reveals microstructural abnormalities in preterm infants at term-equivalent age
- PMID: 22194382
- PMCID: PMC8050470
- DOI: 10.3174/ajnr.A2859
Quantitative fiber tracking in the corpus callosum and internal capsule reveals microstructural abnormalities in preterm infants at term-equivalent age
Abstract
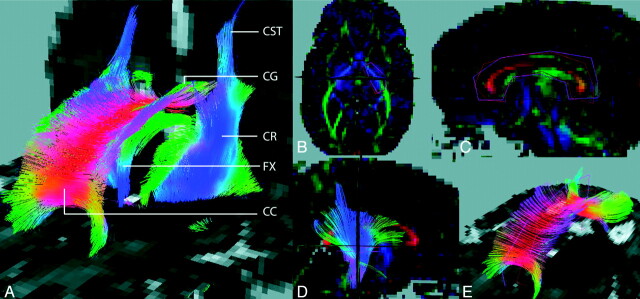
Background and purpose: Signal-intensity abnormalities in the PLIC and thinning of the CC are often seen in preterm infants and associated with poor outcome. DTI is able to detect subtle abnormalities. We used FT to select bundles of interest (CC and PLIC) to acquire additional information on the WMI.
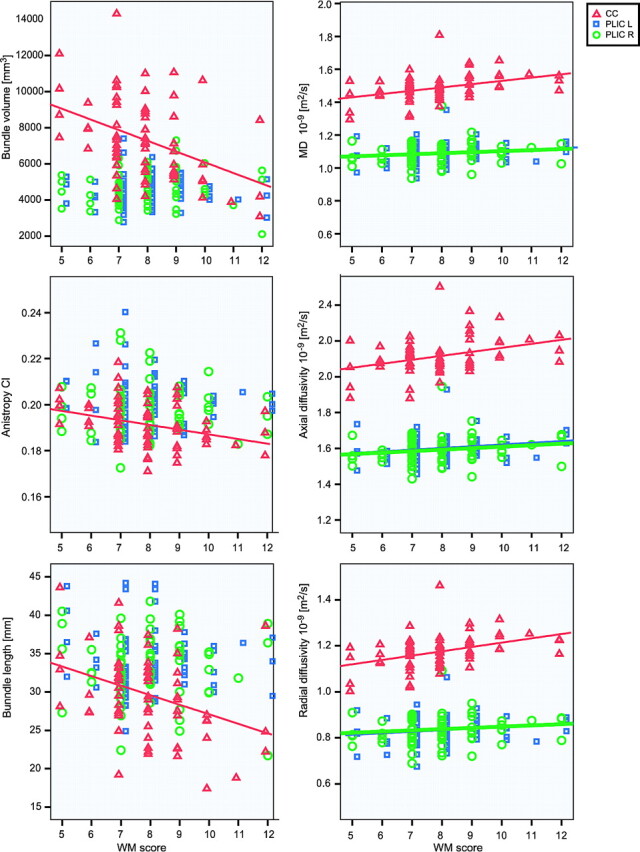
Materials and methods: One hundred twenty preterm infants born at <31 weeks' gestation with 3T DTI at TEA entered this prospective study. Quantitative information (ie, volume, length, anisotropy, and MD) was obtained from fiber bundles passing through the PLIC and CC. A general linear model was used to assess the effects of factor (sex) and variables (GA, BW, HC, PMA, and WMI) on FT-segmented parameters.
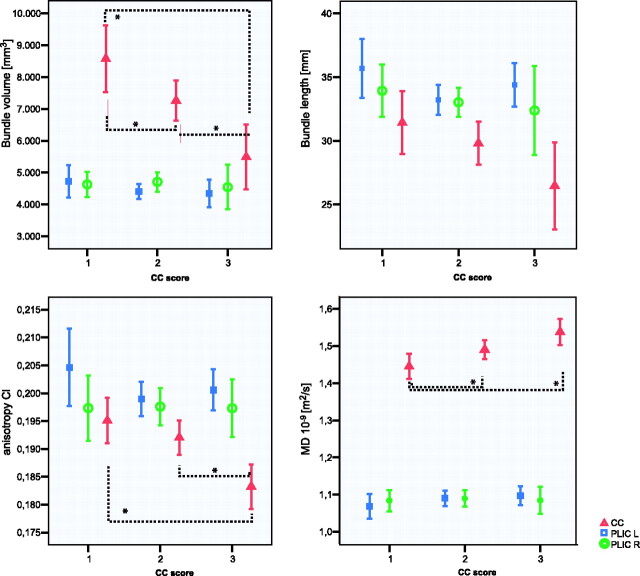
Results: Seventy-two CC and 85 PLIC fiber bundles were assessed. For the CC, increasing WMI and decreasing FA (P = .038), bundle volume (P < .001), and length (P = .001) were observed, whereas MD increased (P = .001). For PLIC, MD increased with increasing WMI (P = .002). Higher anisotropy and larger bundle length were observed in the left PLIC compared with the right (P = .003, P = .018).
Conclusions: We have shown that in the CC bundle, anisotropy was decreased and diffusivity was increased in infants with high WMI scores. A relation of PLIC with WMI was also shown but was less pronounced. Brain maturation is affected more if birth was more premature.
Figures
Similar articles
-
Fiber tracking at term displays gender differences regarding cognitive and motor outcome at 2 years of age in preterm infants.Pediatr Res. 2011 Dec;70(6):626-32. doi: 10.1203/PDR.0b013e318232a963. Pediatr Res. 2011. PMID: 21857376
-
Brain microstructural development at near-term age in very-low-birth-weight preterm infants: an atlas-based diffusion imaging study.Neuroimage. 2014 Feb 1;86:244-56. doi: 10.1016/j.neuroimage.2013.09.053. Epub 2013 Oct 1. Neuroimage. 2014. PMID: 24091089 Free PMC article.
-
Tractography of developing white matter of the internal capsule and corpus callosum in very preterm infants.Eur Radiol. 2011 Mar;21(3):538-47. doi: 10.1007/s00330-010-1945-x. Epub 2010 Sep 12. Eur Radiol. 2011. PMID: 20835871 Free PMC article.
-
Assessing sequence and relationship of regional maturation in corpus callosum and internal capsule in preterm and term newborns by diffusion-tensor imaging.Int J Dev Neurosci. 2014 May;34:42-7. doi: 10.1016/j.ijdevneu.2014.01.004. Epub 2014 Jan 27. Int J Dev Neurosci. 2014. PMID: 24480665
-
Altered microstructure of white matter except the corpus callosum is independent of prematurity.Neonatology. 2012;102(4):309-15. doi: 10.1159/000341867. Epub 2012 Sep 12. Neonatology. 2012. PMID: 22986463
Cited by
-
Acquisition guidelines and quality assessment tools for analyzing neonatal diffusion tensor MRI data.AJNR Am J Neuroradiol. 2013 Aug;34(8):1496-505. doi: 10.3174/ajnr.A3465. Epub 2013 Mar 21. AJNR Am J Neuroradiol. 2013. PMID: 23518355 Free PMC article. Review.
-
Cerebral White Matter Maturation Patterns in Preterm Infants: An MRI T2 Relaxation Anisotropy and Diffusion Tensor Imaging Study.J Neuroimaging. 2018 Jan;28(1):86-94. doi: 10.1111/jon.12486. Epub 2017 Dec 5. J Neuroimaging. 2018. PMID: 29205635 Free PMC article.
-
Accelerated corpus callosum development in prematurity predicts improved outcome.Hum Brain Mapp. 2015 Oct;36(10):3733-48. doi: 10.1002/hbm.22874. Epub 2015 Jun 24. Hum Brain Mapp. 2015. PMID: 26108187 Free PMC article.
-
Data quality in diffusion tensor imaging studies of the preterm brain: a systematic review.Pediatr Radiol. 2015 Aug;45(9):1372-81. doi: 10.1007/s00247-015-3307-y. Epub 2015 Mar 29. Pediatr Radiol. 2015. PMID: 25820411 Free PMC article.
-
Early structural connectivity within the sensorimotor network: Deviations related to prematurity and association to neurodevelopmental outcome.Front Neurosci. 2022 Nov 25;16:932386. doi: 10.3389/fnins.2022.932386. eCollection 2022. Front Neurosci. 2022. PMID: 36507362 Free PMC article.
References
-
- Bhutta AT, Cleves MA, Casey PH, et al. . Cognitive and behavioral outcomes of school-aged children who were born preterm: a meta-analysis. JAMA 2002;288: 728–37 - PubMed
-
- Woodward LJ, Anderson PJ, Austin NC, et al. . Neonatal MRI to predict neurodevelopmental outcomes in preterm infants. N Engl J Med 2006;355: 685–94 - PubMed
-
- Latal B. Prediction of neurodevelopmental outcome after preterm birth. Pediatr Neurol 2009;40: 413–19 - PubMed
-
- Counsell SJ, Boardman JP. Differential brain growth in the infant born preterm: current knowledge and future developments from brain imaging. Semin Fetal Neonatal Med 2005;10: 403–10 - PubMed
-
- Dudink J, Kerr JL, Paterson K, et al. . Connecting the developing preterm brain. Early Hum Dev 2008;84: 777–82 - PubMed
Publication types
MeSH terms
LinkOut - more resources
Full Text Sources
Medical