. 2012 Feb 1;72(3):655-65.
doi: 10.1158/0008-5472.CAN-11-3102. Epub 2011 Dec 22.

A novel FoxM1-caveolin signaling pathway promotes pancreatic cancer invasion and metastasis

Affiliations

A novel FoxM1-caveolin signaling pathway promotes pancreatic cancer invasion and metastasis

Chen Huang et al. Cancer Res. .

Abstract

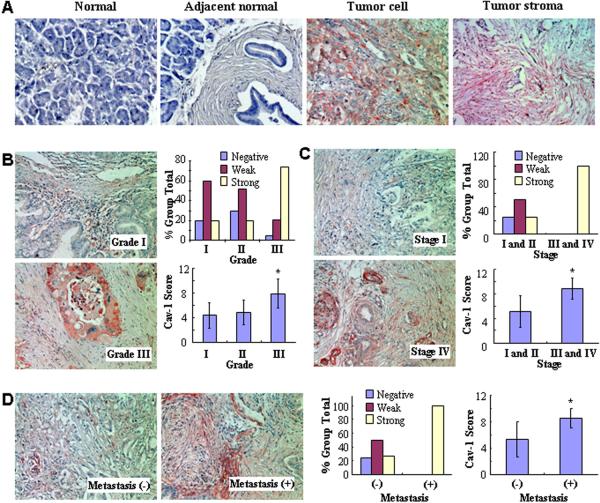
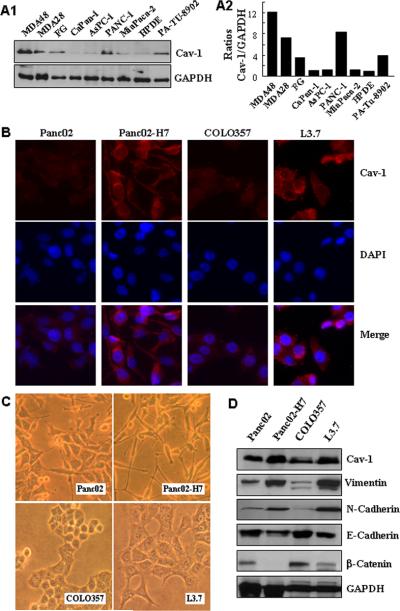
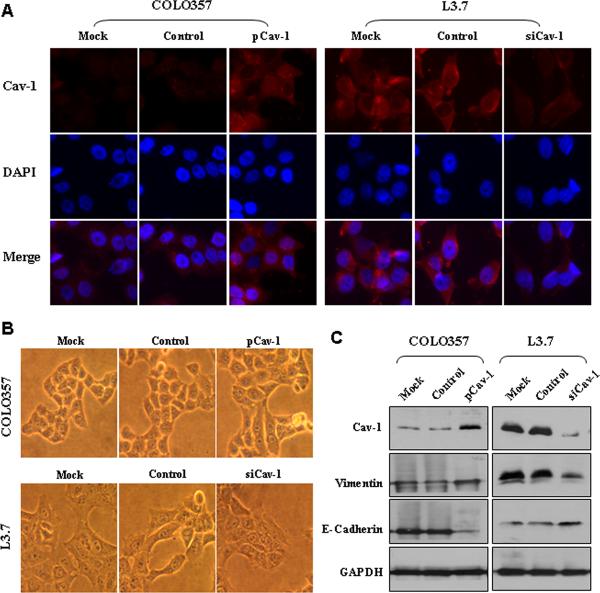
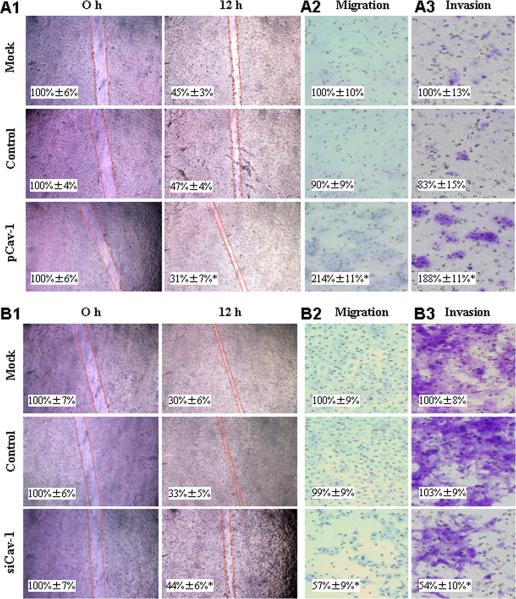
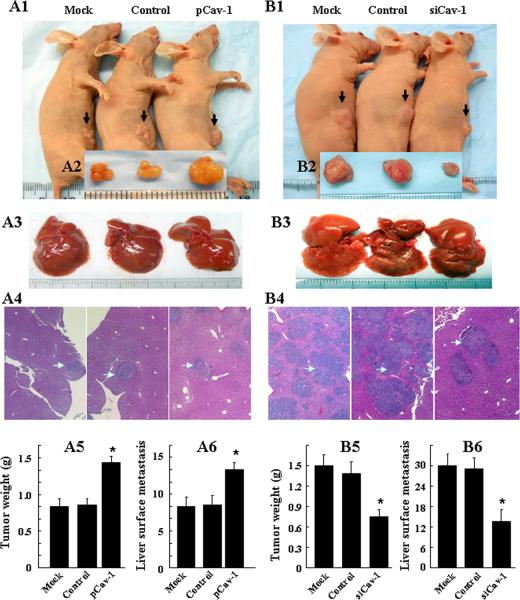
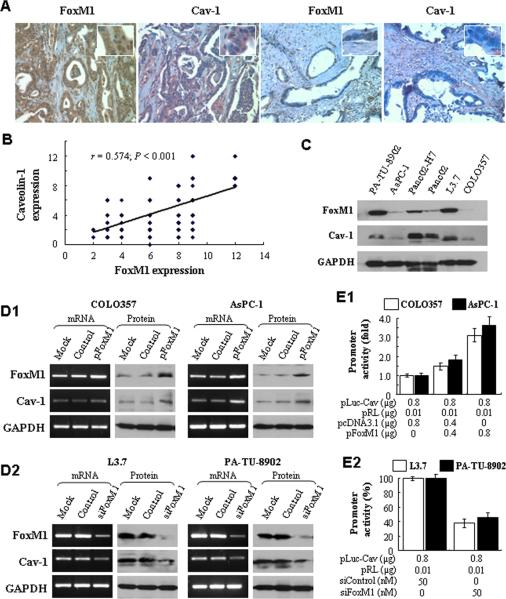
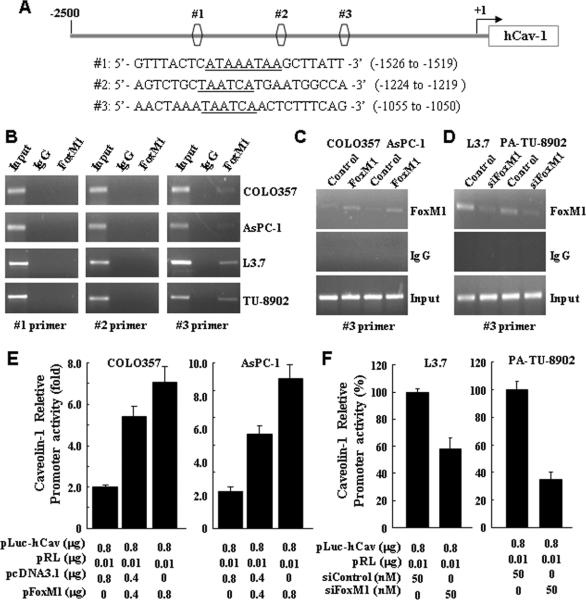
Caveolin-1 (Cav-1), a principal structural component of caveolar membrane domains, contributes to cancer development but its precise functional roles and regulation remain unclear. In this study, we determined the oncogenic function of Cav-1 in preclinical models of pancreatic cancer and in human tissue specimens. Cav-1 expression levels correlated with metastatic potential and epithelial-mesenchymal transition (EMT) in both mouse and human pancreatic cancer cells. Elevated levels in cells promoted EMT, migration, invasion, and metastasis in animal models, whereas RNA interference (RNAi)-mediated knockdown inhibited these processes. We determined that levels of Cav-1 and the Forkhead transcription factor FoxM1 correlated directly in pancreatic cancer cells and tumor tissues. Enforced expression of FoxM1 increased Cav-1 levels, whereas RNAi-mediated knockdown of FoxM1 had the opposite effect. FoxM1 directly bound to the promoter region of Cav-1 gene and positively transactivated its activity. Collectively, our findings defined Cav-1 as an important downstream oncogenic target of FoxM1, suggesting that dysregulated signaling of this novel FoxM1-Cav-1 pathway promotes pancreatic cancer development and progression.


Figures

Fig. 1
Fig. 1. Cav-1 expression in pancreatic cancer specimens and its association with pancreatic cancer pathological features
A, TMA immunostaining using a specific antibody against Cav-1. Representative photos of Cav-1 protein expression in normal pancreatic tissue, adjacent normal pancreatic tissue and pancreatic cancer tissue were shown (200×). Note that the majority of the normal and adjacent normal pancreatic tissue cells were negative for Cav-1 expression, whereas pancreatic cancer tissue cells and stroma were strongly positive for Cav-1 expression; B, Cav-1 expression was positively correlated with tumor differentiation (P<0.01) and representative photos of Grade 1 and 3 tumors were shown (200×), the numbers of samples of grade 1, 2, and 3 were 10, 41, and 19, respectively; C, Cav-1 expression was positively correlated with disease stage (P<0.01) and representative photos of Stage 1 and 4 tumors were shown (200×), the numbers of samples of stage 1, 2, 3, and 4 is 35, 26, 3, and 6, respectively; D, Cav-1 expression was positively correlated with tumor metastasis (P<0.01) and representative photos of tumors from patients with or without distant metastasis were shown (200×).
Fig. 2
Fig. 2. Cav-1 expression and EMT, and metastatic potential of pancreatic cancer cells
A1, Western blot analysis of Cav-1 protein expression in pancreatic cancer cell lines; A2, Western blot quantitative results were obtained by densitometric analysis, standardized to GAPDH, and expressed as fold of HPDE; B, Double immunofluorescence staining for Cav-1 (red), and nuclei (DAPI; blue). Note that highly metastatic L3.7 and Panc02-H7 cells displayed strong positive Cav-1 staining, whereas poorly metastatic COLO357 and Panc02 cells displayed weak positive Cav-1staining; C, Phase-contrast photomicrographs. Note that highly metastatic L3.7 and Panc02-H7 cells exhibited a typical mesenchymal morphology, whereas poorly metastatic COLO357 and Panc02 cells exhibited a typical epithelial morphology; D, Western blot analysis of expression levels of E-cadherin, β-catenin, Vimentin and N-cadherin. Note that highly metastatic L3.7 and Panc02-H7 cells possessed high expression of mesenchymal marker (Vimentin, N-cadherin) and low epithelial marker (E-cadherin, β-catenin), while poorly metastatic COLO357 and Panc02 cells possessed high epithelial marker (E-cadherin and β-catenin) and low expression of mesenchymal marker (Vimentin and N-cadherin).
Fig. 3
Fig. 3. Influence of altered Cav-1 expression on pancreatic cancer cell epithelial or mesenchymal phenotype
A, Double immunofluorescence staining for Cav-1 (red), and nuclei (DAPI; blue). COLO357 cells were transfected with control pcDNA3.1 vector (“Control”) or pcDNA3.1-Cav-1 expression vector (“pCav-1) or just transfection reagent (“Mock”), whereas L3.7 cells were transfected with control siRNA (“Control”) or siRNA against Cav-1 (“siCav-1) or just transfection reagent (“Mock”); B, Phase-contrast photomicrographs of COLO357 cells with Cav-1 overexpression or L3.7 cells with Cav-1 knockdown (as described in Fig. 3A); C, Western blot analysis of EMT markers. Total protein lysates were prepared from COLO357 cells with Cav-1 overexpression or L3.7 cells with Cav-1 knockdown (as described in Fig. 3A).
Fig. 4
Fig. 4. Influence of Cav-1 expression on pancreatic cancer cell migration and invasion
COLO357 (A panels) and L3.7 cells (B panels) were transfected with pcDNA3.1-Cav-1 and Cav-1 siRNA for 48 h, respectively. For cell scratch-wound assay, the cultures were wounded by scratching and maintained at 37°C for additional 12 h. Cell cultures were photographed and cell migration was assessed by measuring gap sizes (inserted number represented percent area of gap ± SD) (A1 and B1). For cell migration assay, the transfected cells were maintained at 37°C for additional 24 h. Representative tumor cell migrated through a membrane were photographed, while the numbers of cells that migrated through the membrane without Matrigel were counted in 5 random fields identified within the lower surface of the membrane and expressed as % of mock control (inserted numbers). Data represents mean ± SD of triplicates (A2 and B2). For cell invasion assay, the transfected cells were maintained at 37°C for additional 48 h. Representative tumor cell invaded through Matrigel were photographed, while the numbers of invasive cells that penetrated through Matrigel-coated filter were counted in 5 random fields identified within the lower surface of the filters and expressed as % of mock control (inserted numbers). Data represents mean ± SD of triplicates (A3 and B3). *, P<0.01 in a comparison of the pCav-1-or si-Cav-1-treated group with the Mock or Control groups.
Fig. 5
Fig. 5. Influence of Cav-1 expression on pancreatic cancer growth and metastasis
COLO357 cells with Cav-1 overexpression (A panels) or L3.7 cells with Cav-1 knockdown (B panels) were injected subcutaneously (1×10⁵/mouse) into the right scapular region of nude mice, or intravenously (COLO357, 1×10⁶/mouse; L3.7, 1×10⁵/mouse) into the ileocolic vein of nude mice (n=5). The tumor-bearing mice were sacrificed when they became moribund or on day 21 (intravenous injection) or day 35 (subcutaneous injection). Shown were gross tumors in the mice (A1 and B1), the tumors removed from the mice (A2 and B2), gross liver metastatic tumors in the liver (A3 and B3) and H&E-stained sections of liver (A4 and B4), tumors weights (A5 and B5), and the numbers of liver surface metastases (A6 and B6). *, P<0.01 in a comparison of the pCav-1-or si-Cav-1-treated group with the Mock or Control groups.
Fig. 6
Fig. 6. Co-expression of FoxM1 and Cav-1 expression in pancreatic cancer
A, Immunohistochemical staining with specific anti-FoxM1 and anti-Cav-1 antibodies were done on pancreatic cancer specimens. Shown were representative photos of positive (left two panels) and negative (right two panels) FoxM1 and Cav-1 staining in pancreatic cancer sections (200×, 400× for the inserts); B, Direct correlation between FoxM1 expression and Cav-1 expression in pancreatic cancer samples (n=70; Pearson's correlation test r = 0.574; P< 0.001). Note that some of the dots on the graphs represented more than one specimen (overlapped scores); C, Western blot analysis of FoxM1 and Cav-1 protein expression in pancreatic cancer cell lines; D, COLO357 and AsPC-1 cells were transfected with pcDNA3.1-FoxM1 or pcDNA3.1 (D1) or L3.7 and PA-TU-8902 cells were transfected with FoxM1-siRNA or control siRNA (D2), and the cultures were incubated for 48 h. Total RNA and protein lysates were harvested for determination of the levels of FoxM1 and Cav-1 expression using RT-PCR (left panels) and Western blot analysis (right panels); E, Effects of FoxM1 expression on Cav-1 promoter activity. COLO357 and AsPC-1 cells were co-transfected with 0.8μg of the Cav-1 promoter luciferase construct pLuc-Cav and 0–0.8μg of pcDNA3.1-FoxM1 or pcDNA3.1 (E1), while L3.7 and PA-TU-8902 cells were co-transfected with 0.8μg pLuc-Cav and 50 nM FoxM1-siRNA or control siRNA (E2). Promoter activities were determined using Dual-luciferase assay kit.
Fig. 7
Fig. 7. Direct binding of FoxM1 to Cav-1 promoter
A, Sequences and positions of putative FoxM1-binding elements on the Cav-1 promoter (#1, #2 and #3); B, ChIP assay. Chromatins were isolated from COLO357, AsPC-1, L3.7 and PA-TU-8902 cells and binding of FoxM1 to the Cav-1 promoter was determined using a specific anti-FoxM1 antibody and oligonucleotides flanking the Cav-1 promoter regions containing putative FoxM1-binding sites as described in Materials and Methods; C & D, similar ChIP assays were performed using chromatins isolated from COLO357, COLO357-FoxM1, AsPC-1 and AsPC-1-FoxM1 cells (C) or L3.7, L3.7-siFoxM1, PA-TU-8902 and PA-TU-8902-siFoxM1 cells (D). Normal IgG was used as a control, and 1% of the total cell lysates was also subjected to PCR before immunoprecipitation (input control). E & F, COLO357 and AsPC-1 cells were co-transfected with 0.8μg of the hCav-1 promoter luciferase construct pLuc-hCav and 0–0.8μg of pcDNA3.1-FoxM1 or pcDNA3.1 (E), while L3.7 and PA-TU-8902 cells were co-transfected with 0.8μg pLuc-hCav and 50 nM FoxM1-siRNA or control siRNA (F). Promoter activities were determined using Dual-luciferase assay kit.

References

    1. Jemal A, Siegel R, Xu J, Ward E. Cancer statistics, 2010. CA Cancer J Clin. 2010;60:277–300. - PubMed
    1. Nieto J, Grossbard ML, Kozuch P. Metastatic pancreatic cancer 2008: is the glass less empty. Oncologist. 2008;13:562–76. - PubMed
    1. Pliarchopoulou K, Pectasides D. Pancreatic cancer: current and future treatment strategies. Cancer Treat Rev. 2009;35:431–6. - PubMed
    1. Stathis A, Moore MJ. Advanced pancreatic carcinoma: current treatment and future challenges. Nat Rev Clin Oncol. 2010;7:163–72. - PubMed
    1. Couet J, Belanger MM, Roussel E, Drolet MC. Cell biology of caveolae and caveolin. Adv Drug Deliv Rev. 2001;49:223–35. - PubMed

Publication types

MeSH terms