. 2012 Feb 24;287(9):6668-78.
doi: 10.1074/jbc.M111.271346. Epub 2011 Dec 22.

Heparanase induces signal transducer and activator of transcription (STAT) protein phosphorylation: preclinical and clinical significance in head and neck cancer

Affiliations

Heparanase induces signal transducer and activator of transcription (STAT) protein phosphorylation: preclinical and clinical significance in head and neck cancer

Victoria Cohen-Kaplan et al. J Biol Chem. .

Abstract

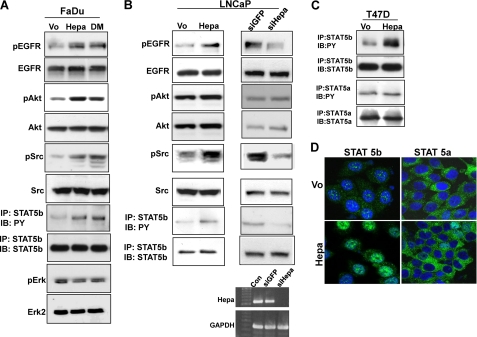
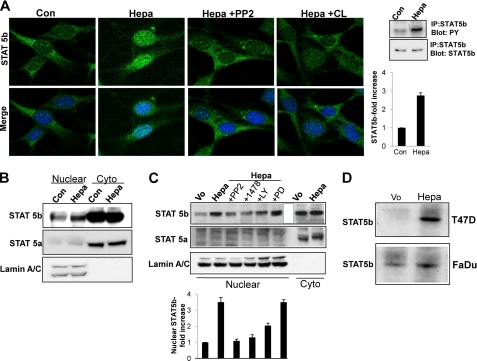
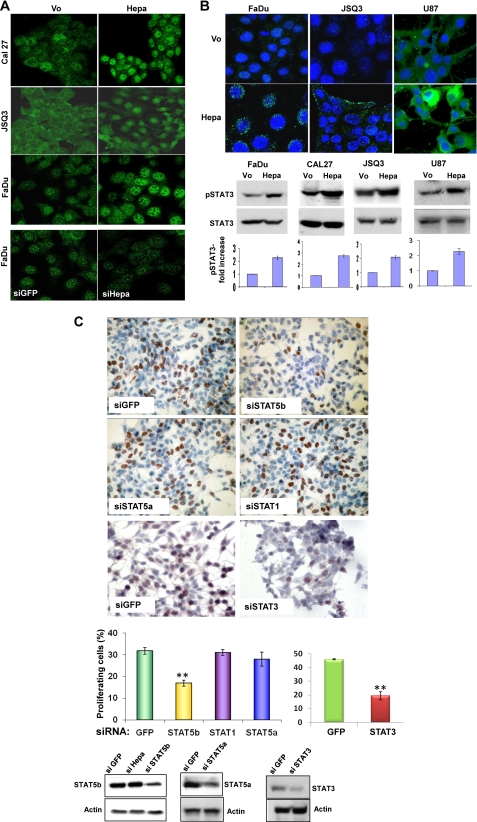
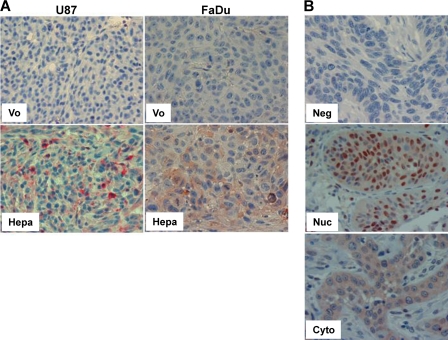
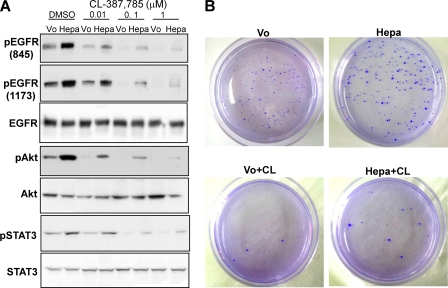
Activity of heparanase is implicated strongly in dissemination of metastatic tumor cells and cells of the immune system. In addition, heparanase enhances the phosphorylation of selected signaling molecules, including SRC and EGFR, in a manner that requires secretion but not enzymatic activity of heparanase and is mediated by its C-terminal domain. Clinically, heparanase staining is associated with larger tumors and increased EGFR phosphorylation in head and neck carcinoma. We hypothesized that signal transducer and activator of transcription (STAT) proteins mediate the protumorigenic function of heparanase downstream of the EGFR. We provide evidence that heparanase enhances the phosphorylation of STAT3 and STAT5b but not STAT5a. Moreover, enhanced proliferation of heparanase transfected cells was attenuated by STAT3 and STAT5b siRNA, but not STAT5a or STAT1 siRNA. Clinically, STAT3 phosphorylation was associated with head and neck cancer progression, EGFR phosphorylation, and heparanase expression and cellular localization. Notably, cytoplasmic rather than nuclear phospho-STAT3 correlated with increased tumor size (T-stage; p = 0.007), number of metastatic neck lymph nodes (p = 0.05), and reduced survival of patients (p = 0.04).


Figures

FIGURE 1.
FIGURE 1.
Heparanase enhances STAT5b phosphorylation. FaDu pharynx carcinoma (A) and LNCaP prostate carcinoma (B, left panels) cells were stably transfected with control empty vector (Vo), wild type (Hepa), or mutated inactive (double mutated (DM)) heparanase gene constructs and cell lysates were subjected to immunoblotting applying anti-pEGFR (upper panels), anti-EGFR (second panels), anti-pAKT (third panels), anti-AKT (fourth panels), anti-pSrc (fifth panels), anti-Src (sixth panels), anti-pErk (ninth panel), and anti-Erk 2 (tenth panel) antibodies. Corresponding lysates were subjected to immunoprecipitation (IP) with anti-STAT5b antibody, followed by immunoblotting (IB) with anti-phosphotyrosine (PY, seventh panels) or anti STAT5b (eighth panels) antibodies. LNCaP prostate carcinoma cells were left untreated (Con) or were transfected with anti-GFP or anti-heparanase (siHepa) siRNA oligonucleotides. Total RNA was extracted 2 days following transfection, and heparanase expression was examined by RT-PCR analysis. GAPDH transcript was used as an internal control for RNA loading (B, right lower panels). Cell lysates were prepared from corresponding LNCaP cells and subjected to immunoblotting applying the antibodies described above (B, right panels). C, T47D breast carcinoma cells were stably transfected with heparanase gene construct (Hepa) or an empty vector (Vo), and cell lysates were immunoprecipitated with antibodies directed against STAT5b (upper panel) or STAT5a (third panel) followed by immunoblotting with anti-phosphotyrosine antibody (PY). Membranes were then striped and reprobed with anti-STAT5b (second panel) or anti-STAT5a (fourth panel) antibodies. D, immunofluorescent staining. Control (Vo, upper panels) and heparanase-transfected (Hepa, lower panels) T47D cells were stained with anti-STAT5b (left panels) or anti-STAT5a (right panels) antibodies (green). Nuclei counterstaining (DAPI) appears in blue. Note the nuclear translocation of STAT5b but not STAT5a in heparanase overexpressing cells. Original magnification, ×63.
FIGURE 2.
FIGURE 2.
STAT5b phosphorylation and nuclear translocation by heparanase is mediated by SRC and EGFR. A, inhibition study. Mouse embryonic fibroblasts were left untreated (Con) or were incubated with heparanase without (Hepa) or after the cells were preincubated with PP2 (5 μm) or CL-387785 (CL; 0.1 μm) for 30 min. Following a 1-h incubation with heparanase, cells were fixed and stained with anti-STAT5b antibody (upper panels). Merge images with DAPI counter staining (blue) are shown in the lower panels. Original magnification, ×63. Corresponding control (Vo) and heparanase-transfected cell lysates were immunoprecipitated (IP) with anti-STAT5b antibody followed by immunoblotting with anti-phosphotyrosine (PY) or anti STAT5b antibodies (rightmost panels). Densitometry analysis of pSTAT5b is shown in the right lower panel. B, control (Con) and heparanase-treated (Hepa) cells from corresponding cultures were fractionated into nuclear and cytoplasmic (Cyto) fractions and subjected to immunoblotting applying antibodies directed against STAT5b (upper panel), STAT5a (middle panel), and lamin A/C to validate fraction purity and protein loading (lower panel). C, heparanase-transfected FaDu cells were left untreated (Hepa) or incubated (4 h) with SRC (PP2, 5 μm), EGFR (1478, 5 μm), PI3K (LY, 15 μm), or MEK (PD, 10 μm) inhibitors. Nuclear fractions were then prepared and subjected to immunoblotting applying anti-STAT5b (upper panel), anti-STAT5a (second panel) and anti-lamin A/C (third panel) antibodies. Nuclear fraction of control (Vo) cells and cytoplasmic fractions (Cyto) of control (Vo) and heparanase-transfected (Hepa) cells were included as control. Densitometry analysis of nuclear STAT5b levels is shown in the lower panel. D, DNA binding. Nuclear extracts of control (Vo) and heparanase-transfected (Hepa) T47D (upper panel) and FaDu (second panel) cells were incubated (20 h, 4 °C) with biotinylated oligonucleotides containing the STAT5 binding site of the bovine β-casein promoter. Strepavidin-agarose beads were then added for 60 min, and, after washing, agarose-bound material was subjected to immunoblotting with anti-STAT5b antibody. Note the increased STAT5b association with the casein gene promoter following heparanase overexpression.
FIGURE 3.
FIGURE 3.
Heparanase modulates STAT5b and STAT3 phosphorylation. A, heparanase overexpression and gene silencing. Cal27 (upper panels), JSQ3 (second panels), and FaDu cells (third panels) were transfected with an empty vector (Vo) or heparanase gene construct (Hepa), and stably transfected cells were subjected to immunofluorescent staining with anti-STAT5b antibody. FaDu cells were transfected similarly with anti-GFP (siGFP) or anti-heparanase (siHepa) siRNA oligonucleotides. Three days thereafter, cells were subjected to immunofluorescent staining with anti-STAT5b antibody (lower panels). Note increased nuclear STAT5b in heparanase-overexpressing cells and decreased nuclear STAT5b following heparanase gene silencing. Original magnification, ×40. B, STAT3 phosphorylation. FaDu (lower left panels), Cal27 (second left panel), JSQ3 (second right panel), and U87 (lower right panels) cells were transfected with empty control (Vo) or heparanase expression vector (Hepa), and lysate samples were subjected to immunoblotting applying anti-pSTAT3 or anti-STAT3 antibodies. STAT3 phosphorylation index calculated by densitometry analysis (Vo cells arbitrary set to a value of 1) of at least five independent experiments is shown in the bottom panels. Control (Vo) and heparanase-transfected (Hepa) FaDu (upper left panel), JSQ3 (middle panels), and U87 (upper right panels) cells were also subjected to immunofluorescent staining applying anti-pSTAT3 antibody (green); nuclei counterstaining (DAPI) is shown in blue. Original magnification, ×63. C, BrdU incorporation. Subconfluent heparanase-transfected LNCaP cells were transfected with control (siGFP), anti-STAT5b, anti-STAT5a, anti-STAT1, or anti-STAT3 siRNA oligonucleotides. After recovery for 2 days in growth medium, cells were kept in serum-free medium for 20 h followed by incubation with BrdU (1:1000) for 2 h. Cells were then fixed and immunostained with anti BrdU monoclonal antibodies. Positively stained, red-brown nuclei were counted versus blue, hematoxylin counterstained nuclei (upper panel). At least 1000 cells were counted for each cell type, and the percentage of positively stained cells is noted in each bar. Decreased STAT3, STAT5b and STAT5a levels following siRNA transfection are shown in the lower panels.
FIGURE 4.
FIGURE 4.
Immunohistochemistry analysis of pSTAT3. A, tumor xenografts. Formalin-fixed, paraffin-embedded 5-micron sections of xenografts produced by control (Vo) and heparanase-transfected U87 (left panels) and FaDu (right panels) cells were stained with anti-pSTAT3 antibody. Note increased reactivity in heparanase-transfected cells, assuming cytoplasmic localization. B, tumor biopsies. Formalin-fixed, paraffin-embedded 5-micron sections of head and neck tumor biopsies were subjected to immunostaining applying anti-pSTAT3 antibody, as described under “Materials and Methods.” Shown are representative photomicrographs of pSTAT3-negative (Neg; upper panel) and positively stained specimens exhibiting prevalent nuclear (Nuc; middle panel) or cytoplasmic (Cyto; lower panel) localization. Original magnification, ×40.
FIGURE 5.
FIGURE 5.
Cells overexpressing heparanase are less sensitive to EGFR inhibitor. A, control (Vo) and heparanase-transfected (Hepa) FaDu cells were incubated with the indicated concentration (μm) of CL-387785 for 2 h. Vehicle (dimethyl sulfoxide (DMSO)) was used as control. Total cell lysates were subjected to immunoblotting with antibodies directed against the phosphorylated state of EGFR (pEGFR, upper and second panels), AKT (pAKT, fourth panel), and STAT3 (pSTAT3, sixth panel). Total amounts of EGFR, AKT, and STAT3 are shown in the third, fifth, and seventh panels, respectively. Note the sustained EGFR signaling in heparanase overexpressing cells even in the presence of high doses (1 μm) of CL-387785. B, colony formation. Control (Vo) and heparanase-transfected (Hepa) FaDu cells (5 × 10³) were mixed with soft agar and cultured for 3 weeks in the absence or presence of EGFR inhibitor, CL-387785 (CL, 0.1 μmol/liter). Shown are photomicrographs of colonies at low (×10) magnification. Note more and larger colonies produced by heparanase overexpressing cells following EGFR inhibition compared with control cells.

Similar articles

Cited by

References

    1. Parish C. R., Freeman C., Hulett M. D. (2001) Heparanase: a key enzyme involved in cell invasion. Biochim. Biophys. Acta 1471, M99–108 - PubMed
    1. Vlodavsky I., Friedmann Y. (2001) Molecular properties and involvement of heparanase in cancer metastasis and angiogenesis. J. Clin. Invest. 108, 341–347 - PMC - PubMed
    1. Dempsey L. A., Brunn G. J., Platt J. L. (2000) Heparanase, a potential regulator of cell-matrix interactions. Trends Biochem. Sci. 25, 349–351 - PubMed
    1. Ilan N., Elkin M., Vlodavsky I. (2006) Regulation, function, and clinical significance of heparanase in cancer metastasis and angiogenesis. Int. J. Biochem. Cell Biol. 38, 2018–2039 - PubMed
    1. Sanderson R. D., Yang Y., Kelly T., MacLeod V., Dai Y., Theus A. (2005) Enzymatic remodeling of heparan sulfate proteoglycans within the tumor microenvironment: growth regulation and the prospect of new cancer therapies. J. Cell. Biochem. 96, 897–905 - PubMed

Publication types

MeSH terms