. 2012 Feb 17;287(8):5528-41.
doi: 10.1074/jbc.M111.285114. Epub 2011 Dec 22.

Group VIA PLA2 (iPLA2β) is activated upstream of p38 mitogen-activated protein kinase (MAPK) in pancreatic islet β-cell signaling

Affiliations

Group VIA PLA2 (iPLA2β) is activated upstream of p38 mitogen-activated protein kinase (MAPK) in pancreatic islet β-cell signaling

Haowei Song et al. J Biol Chem. .

Abstract

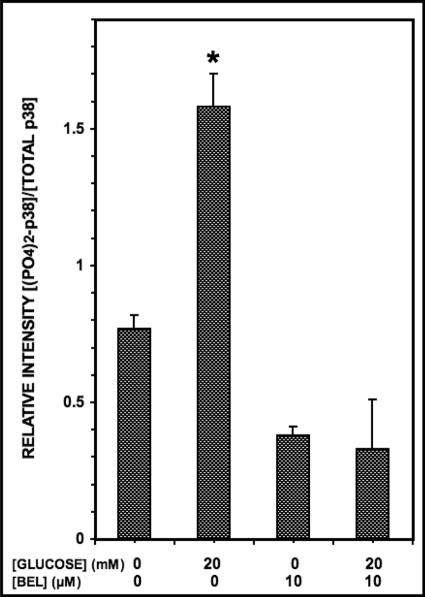
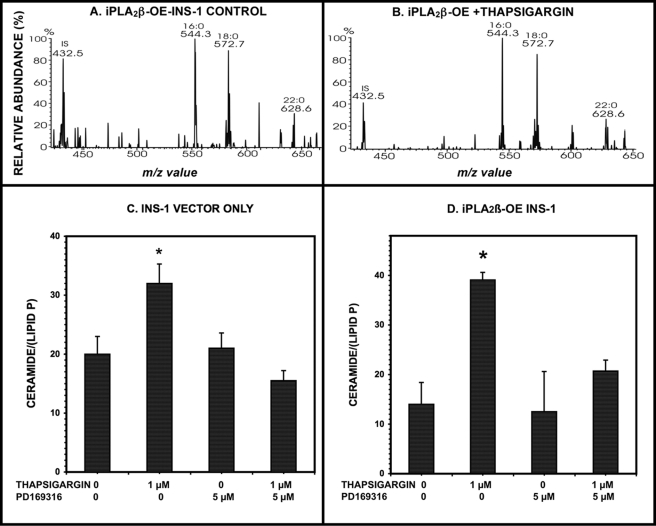
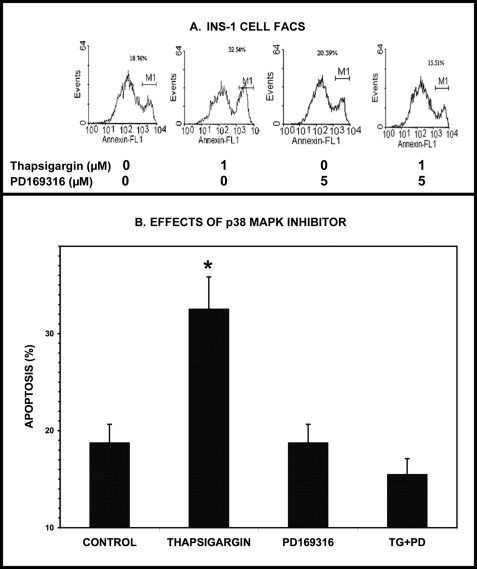
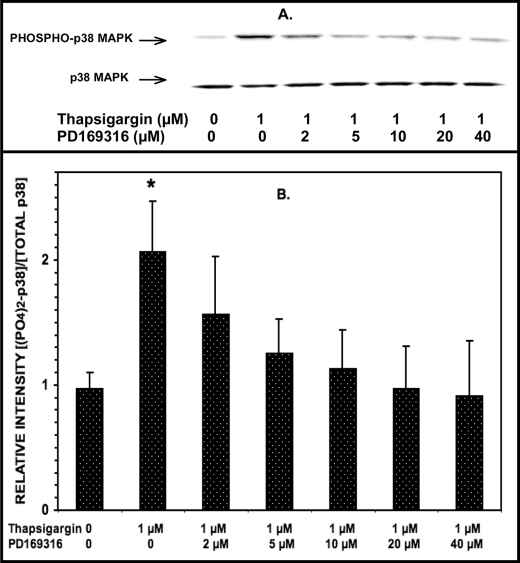
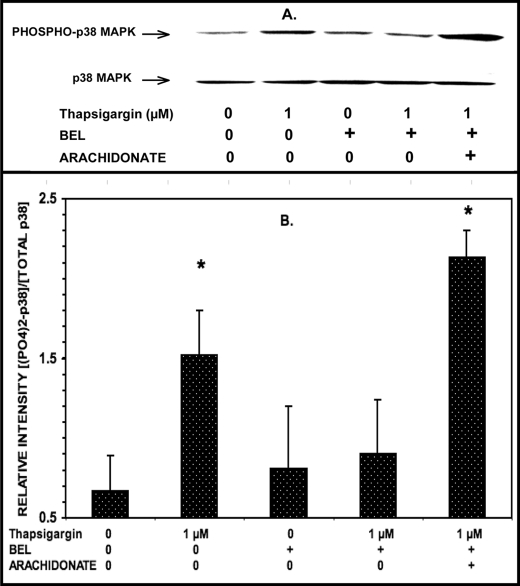
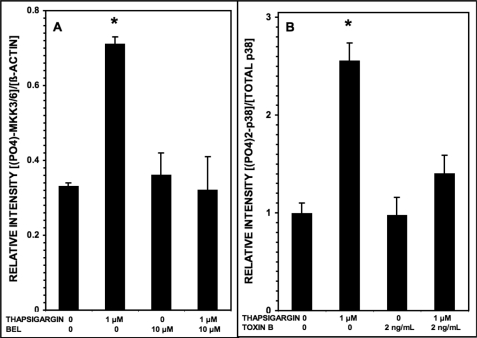
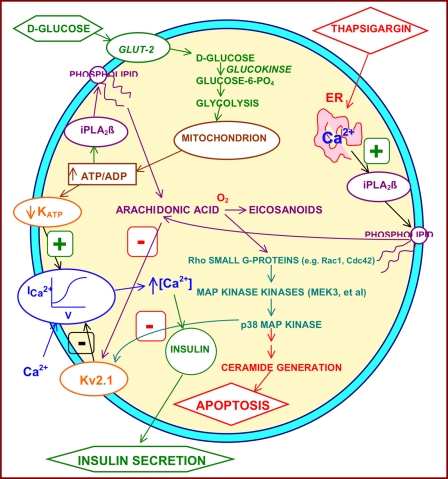
Group VIA phospholipase A(2) (iPLA(2)β) in pancreatic islet β-cells participates in glucose-stimulated insulin secretion and sarco(endo)plasmic reticulum ATPase (SERCA) inhibitor-induced apoptosis, and both are attenuated by pharmacologic or genetic reductions in iPLA(2)β activity and amplified by iPLA(2)β overexpression. While exploring signaling events that occur downstream of iPLA(2)β activation, we found that p38 MAPK is activated by phosphorylation in INS-1 insulinoma cells and mouse pancreatic islets, that this increases with iPLA(2)β expression level, and that it is stimulated by the iPLA(2)β reaction product arachidonic acid. The insulin secretagogue D-glucose also stimulates β-cell p38 MAPK phosphorylation, and this is prevented by the iPLA(2)β inhibitor bromoenol lactone. Insulin secretion induced by d-glucose and forskolin is amplified by overexpressing iPLA(2)β in INS-1 cells and in mouse islets, and the p38 MAPK inhibitor PD169316 prevents both responses. The SERCA inhibitor thapsigargin also stimulates phosphorylation of both β-cell MAPK kinase isoforms and p38 MAPK, and bromoenol lactone prevents both events. Others have reported that iPLA(2)β products activate Rho family G-proteins that promote MAPK kinase activation via a mechanism inhibited by Clostridium difficile toxin B, which we find to inhibit thapsigargin-induced β-cell p38 MAPK phosphorylation. Thapsigargin-induced β-cell apoptosis and ceramide generation are also prevented by the p38 MAPK inhibitor PD169316. These observations indicate that p38 MAPK is activated downstream of iPLA(2)β in β-cells incubated with insulin secretagogues or thapsigargin, that this requires prior iPLA(2)β activation, and that p38 MAPK is involved in the β-cell functional responses of insulin secretion and apoptosis in which iPLA(2)β participates.


Figures

FIGURE 1.
FIGURE 1.
Level of p38 MAPK phosphorylation increases in INS-1 cells and islets with iPLA2β expression level. Lysates from INS-1 cells or isolated pancreatic islets were analyzed by SDS-PAGE, transferred to PVDF membranes, and probed with antibody directed at phosphorylated p38 MAPK (81) (A, upper bands) or total p38 MAPK (A, lower bands). In B, the densitometric ratios of the bands for phospho-p38 and total p38 are plotted for stably transfected INS-1 cells that overexpress (OE) iPLA2β or for INS-1 cells transfected with vector only (Vector). In C, the densitometric ratios of the bands for phospho-p38 and total p38 are plotted for pancreatic islets isolated from transgenic (TG) mice that overexpress iPLA2β in β-cells or from wild type (WT) mice. Mean values (n = 3) are plotted in B and C, and S.E. values (error bars) are indicated. The p value for the comparison in B is 0.0001, and that for the comparison in C is 0.039.
FIGURE 2.
FIGURE 2.
Glucose stimulates p38 MAPK phosphorylation in INS-1-OE cells, and this is prevented by the iPLA2β inhibitor BEL. Stably transfected INS-1 cells that overexpress iPLA2β were preincubated (1 h, 37 °C) with BEL (10 μm) or DMSO vehicle alone. The medium was then replaced by fresh medium containing 20 mm or no d-glucose without or with BEL (10 μm), and the cells were again incubated (30 min, 37 °C). At the end of that incubation interval, cell lysates were prepared and analyzed by SDS-PAGE and immunoblotting with antibody directed at phosphorylated p38 MAPK or total p38 MAPK as in Fig. 1. The figure displays mean values (n = 3) for the densitometric ratios of the bands for phospho-p38 and total p38, and S.E. values (error bars) are indicated. *, p < 0.05 for the value at the indicated condition versus that for 20 mm glucose with BEL.
FIGURE 3.
FIGURE 3.
Secretagogue-induced insulin secretion from INS-1 insulinoma cells and pancreatic islets increases with iPLA2β expression level and is suppressed by pharmacologic inhibition of p38 MAPK. In A, pancreatic islets isolated from wild-type mice (WT; blue or yellow bars) or from transgenic mice (TG; red or green bars) that overexpress iPLA2β in islet β-cells were preincubated (1 h, 37 °C) with the p38 MAPK inhibitor (85) PD169316 (20 μm) (yellow or green bars) or vehicle (blue or red bars) and then placed in fresh KRB medium containing 0 or 20 mm d-glucose without or with 2.5 μm forskolin and incubated (30 min, 37 °C). In B, similar experiments were performed with INS-1 insulinoma cells stably transfected with empty vector (V; blue or yellow bars) or with a construct that causes overexpression of iPLA2β (OE; red or green bars) that were incubated without (blue or red bars) or with (yellow or green bars) PD169316 and with 0 or 20 mm d-glucose and 0 or 2.5 μm forskolin, as in A. At the end of the incubation period, aliquots of medium were removed for measurement of insulin content as described under “Experimental Procedures.” Mean values are displayed, and S.E. values (error bars) are indicated (n = 3). *, p < 0.05 for the comparison of the indicated condition and the analogous condition in which incubation was performed in the presence of PD169316.
FIGURE 4.
FIGURE 4.
Induction of ER stress with thapsigargin induces ceramide accumulation in INS-1 cells, and this is prevented by pharmacologic inhibition of p38 MAPK. INS-1 insulinoma cells stably transfected with a construct that causes overexpression of iPLA2β (OE) or with empty vector (V) were preincubated (1 h, 37 °C) with the p38 MAPK inhibitor PD169316 (5 μm) or with vehicle diluent alone and then placed in fresh KRB medium without or with thapsigargin (1 μm). At the end of the incubation period, cells were collected, homogenized, and extracted by a modified Bligh-Dyer method. The extract was admixed with internal standard C8-ceramide, concentrated, reconstituted, infused in a solution to which Li+ had been added, and analyzed by ESI/MS/MS scanning for constant neutral loss (CNL) of 48 from [M + Li]+ ions as described under “Experimental Procedures.” Quantitation of each ceramide species was achieved by dividing the ion current at the m/z value for that species by the ion current of the internal standard at m/z 432.5 and interpolating from a calibration curve. This value was then normalized to the measured lipid phosphorus content of the sample. A and B, representative CNL spectra from INS-1 cells incubated only with vehicle or with 1 μm thapsigargin, respectively. In C and D, mean values (n = 3) for the normalized total amount of ceramide species under the indicated conditions are displayed for INS-1 cells that are transfected with empty vector (C) or that stably overexpress iPLA2β (D), and S.E. values (error bars) are indicated. *, p < 0.05 for the comparison of the indicated condition versus the analogous condition in which incubation was performed in the presence of PD169316.
FIGURE 5.
FIGURE 5.
Induction of ER stress with thapsigargin induces apoptosis of INS-1-OE cells, and this is prevented by pharmacologic inhibition of p38 MAPK. In A, stably transfected INS-1 insulinoma cells that overexpress iPLA2β were preincubated (1 h, 37 °C) with the p38 MAPK inhibitor PD169316 (5 μm) or with diluent vehicle alone and then placed in fresh KRB medium without or with thapsigargin (1 μm). At the end of the incubation period, cells were collected, stained with Annexin-V, and analyzed by FACS, as described under “Experimental Procedures.” In B, mean values for the percentage of apoptotic cells for each condition are displayed (n = 3), and S.E. values (error bars) are indicated. *, p < 0.05 for the indicated condition versus the analogous condition in which incubation was performed in the presence of PD169316.
FIGURE 6.
FIGURE 6.
Induction of ER stress with thapsigargin stimulates p38 MAPK phosphorylation in INS-1-OE cells, and this is prevented by the p38 MAPK inhibitor PD169316 in a concentration-dependent manner. Stably transfected INS-1 insulinoma cells that overexpress iPLA2β were preincubated (1 h, 37 °C) without or with varied concentrations of the p38 MAPK inhibitor PD169316 (0, 2, 5, 10, 20, or 40 μm). Then the medium was replaced by fresh medium containing 1 μm or no thapsigargin without or with varied concentrations of PD169319 (the same as used in the preincubation) and incubated (30 min, 37 °C). At the end of the incubation interval, cell lysates were prepared and analyzed by SDS-PAGE and immunoblotting with antibody directed at phosphorylated p38 MAPK or total p38 MAPK (A) as in Fig. 1. The immunoblots were analyzed by densitometry, and B displays mean values (n = 3) for the densitometric ratios of the bands for phospho-p38 and total p38. S.E. values (error bars) are indicated. *, p < 0.05 for the value at the indicated condition versus the analogous condition in which incubation was performed in the presence of 40 μm PD169316.
FIGURE 7.
FIGURE 7.
The iPLA2β inhibitor BEL suppresses thapsigargin-induced p38 MAPK phosphorylation in INS-1-OE cells, and this is reversed by exogenous arachidonic acid. Stably transfected INS-1 cells that overexpress iPLA2β were preincubated (1 h, 37 °C) with BEL (10 μm) or DMSO vehicle alone. Then the medium was replaced by fresh medium containing 1 μm or no thapsigargin without or with BEL (10 μm) and without or with exogenous arachidonic acid (70 μm) and incubated (30 min, 37 °C). At the end of the incubation interval, cell lysates were prepared and analyzed by SDS-PAGE and immunoblotting with antibody directed at phosphorylated p38 MAPK or total p38 MAPK (A) as in Fig. 1. B displays mean values (n = 3) for the densitometric ratios of the bands for phospho-p38 and total p38. S.E. values (error bars) are indicated. *, p < 0.05 for the value at the indicated condition versus the condition in which incubation was performed in the presence of 1 μm thapsigargin, 10 μm BEL, and no exogenous arachidonic acid.
FIGURE 8.
FIGURE 8.
Phosphorylation of MAPK kinases 3/6 and of p38 MAPK induced in INS-1-OE cells by thapsigargin is suppressed by the iPLA2β inhibitor BEL and by the Rho family small G-protein inhibitor C. difficile toxin B, respectively. In A, stably transfected INS-1 cells that overexpress iPLA2β were preincubated (1 h, 37 °C) with BEL (10 μm) or DMSO vehicle alone. Then the medium was replaced by fresh medium containing 1 μm or no thapsigargin without or with BEL (10 μm), and the cells were again incubated (30 min, 37 °C). At the end of that incubation interval, cell lysates were prepared and analyzed by SDS-PAGE and immunoblotting with antibody directed at phosphorylated MAPK kinases 3/6 (MKK3/6) or against β-actin. Mean values (n = 3) are displayed for the densitometric ratios of the bands for phospho-MKK3/6 and β-actin, and S.E. values (error bars) are indicated. *, p < 0.05 for the value at the indicated condition versus the condition with 1 μm thapsigargin and 10 μm BEL. In B, stably transfected INS-1 cells that overexpress iPLA2β were preincubated (1 h, 37 °C) with C. difficile toxin B (2 ng/ml) or blank diluent alone. Then the medium was replaced by fresh medium containing 1 μm or no thapsigargin, and the cells were again incubated (30 min, 37 °C). At the end of that incubation interval, cell lysates were prepared and analyzed by SDS-PAGE and immunoblotting with antibody directed at phosphorylated p38 MAPK or total p38 MAPK, as in Fig. 1. The densitometric ratios of the bands for phospho-p38 and total p38 were then determined. Mean values (n = 3) are displayed, and S.E. values are indicated. *, p < 0.05 for the value at the indicated condition versus the condition with 1 μm thapsigargin and 2 ng/ml toxin B.
FIGURE 9.
FIGURE 9.
Schematic diagram of signaling pathways in β-cells in which iPLA2β participates. Signals that induce iPLA2β activation in insulin-secreting β-cells include 1) incubation with concentrations of d-glucose sufficient to stimulate insulin secretion and 2) incubation with SERCA inhibitors (e.g. thapsigargin) that deplete ER Ca2+ content, induce ER stress, and trigger β-cell apoptosis. Activation of iPLA2β occurs in signaling pathways involved both in d-glucose-stimulated insulin secretion and in SERCA inhibitor-induced apoptosis because both sets of responses are attenuated by pharmacologic or genetic reductions in iPLA2β activity, and, conversely, both are amplified by iPLA2β overexpression. The involvement of iPLA2β in insulin secretion may reflect the effect of one of its products, arachidonic acid, to inhibit membrane Kv2.1 channel activity and thereby to prolong the d-glucose-induced action potential in β-cells (62). Amplification of ceramide generation by iPLA2β may represent a component of its participation in apoptosis (65, 71). Data presented in the current paper indicate that p38 MAPK is activated during both glucose-stimulated insulin secretion and SERCA inhibitor-induced apoptosis in β-cells and that this event is downstream of and requires prior iPLA2β activation. Data here and in other studies (–89) suggest that intermediate events between iPLA2β activation and p38 MAPK activation include arachidonic acid release, its enzymatic oxygenation to bioactive eicosanoids (e.g. 12/15-lipoxygenase products), activation of Rho family small G-proteins (e.g. Rac1 and Cdc42), and activation of MAPK kinases (e.g. MEK3).

Similar articles

Cited by

References

    1. Mahler R. J., Adler M. L. (1999) Type 2 diabetes mellitus. Update on diagnosis, pathophysiology, and treatment. J. Clin. Endocr. Metab. 84, 1165–1171 - PubMed
    1. Hossain P., Kawar B., El Nahas M. (2007) Obesity and diabetes in the developing world. A growing challenge. N. Engl. J. Med. 356, 213–215 - PubMed
    1. Hotamisligil G. S., Shargill N. S., Spiegelman B. M. (1993) Adipose expression of tumor necrosis factor-α. Direct role in obesity-linked insulin resistance. Science 259, 87–91 - PubMed
    1. Ogden C. L., Carroll M. D., Curtin L. R., Lamb M. M., Flegal K. M. (2010) Prevalence of high body mass index in US children and adolescents. JAMA 303, 242–249 - PubMed
    1. Laing S. P., Swerdlow A. J., Slater S. D., Burden A. C., Morris A., Waugh N. R., Gatling W., Bingley P. J., Patterson C. C. (2003) Mortality from heart disease in a cohort of 23,000 patients with insulin-treated diabetes. Diabetologia 46, 760–765 - PubMed

Publication types

MeSH terms

LinkOut - more resources