. 2012 Feb 17;287(8):5954-68.
doi: 10.1074/jbc.M111.289322. Epub 2011 Dec 22.

Modified low density lipoprotein stimulates complement C3 expression and secretion via liver X receptor and Toll-like receptor 4 activation in human macrophages

Affiliations

Modified low density lipoprotein stimulates complement C3 expression and secretion via liver X receptor and Toll-like receptor 4 activation in human macrophages

Denis A Mogilenko et al. J Biol Chem. .

Abstract

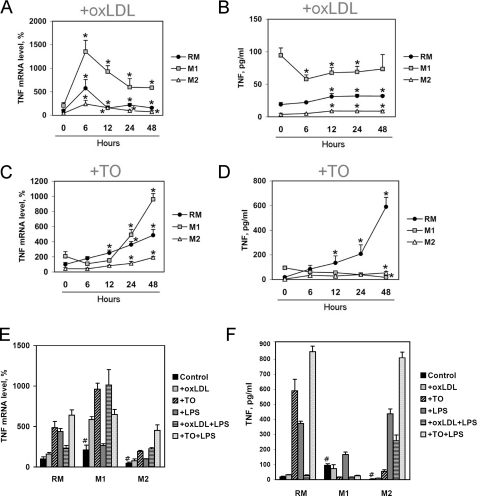
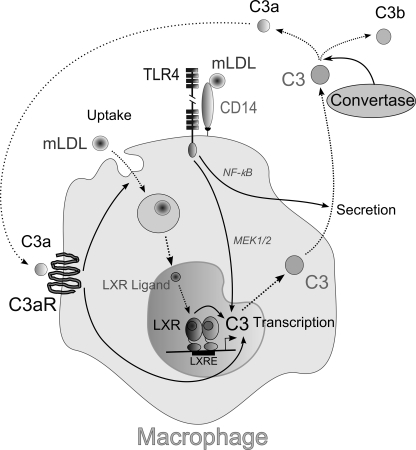
Complement C3 is a pivotal component of three cascades of complement activation. C3 is expressed in human atherosclerotic lesions and is involved in atherogenesis. However, the mechanism of C3 accumulation in atherosclerotic lesions is not well elucidated. We show that acetylated low density lipoprotein and oxidized low density lipoprotein (oxLDL) increase C3 gene expression and protein secretion by human macrophages. Modified LDL (mLDL)-mediated activation of C3 expression mainly depends on liver X receptor (LXR) and partly on Toll-like receptor 4 (TLR4), whereas C3 secretion is increased due to TLR4 activation by mLDL. LXR agonist TO901317 stimulates C3 gene expression in human monocyte-macrophage cells but not in human hepatoma (HepG2) cells. We find LXR-responsive element inside of the promoter region of the human C3 gene, which binds to LXRβ in macrophages but not in HepG2 cells. We show that C3 expression and secretion is decreased in IL-4-treated (M2) and increased in IFNγ/LPS-stimulated (M1) human macrophages as compared with resting macrophages. LXR agonist TO901317 potentiates LPS-induced C3 gene expression and protein secretion in macrophages, whereas oxLDL differently modulates LPS-mediated regulation of C3 in M1 or M2 macrophages. Treatment of human macrophages with anaphylatoxin C3a results in stimulation of C3 transcription and secretion as well as increased oxLDL accumulation and augmented oxLDL-mediated up-regulation of the C3 gene. These data provide a novel mechanism of C3 gene regulation in macrophages and suggest new aspects of cross-talk between mLDL, C3, C3a, and TLR4 during development of atherosclerotic lesions.


Figures

FIGURE 1.
FIGURE 1.
oxLDL, acLDL, and LXR agonist TO191317 stimulate C3 gene and protein expression in human PBM- and THP-1-derived macrophages. A, the level of C3 mRNA in human PBM-derived macrophages (7th day of differentiation); real-time RT-PCR; 100% is the level in the macrophages treated with BSA (control cells). B, the level of C3 mRNA in human THP-1-derived macrophages 24 or 48 h after the addition of BSA, native or modified LDL, or LXR agonist TO191317; real-time RT-PCR; 100% is the level in the THP-1-derived macrophages treated with BSA. C, Western blot analysis of intracellular C3 in PBM-derived macrophages treated with BSA, native and modified LDL, or LXR agonist TO191317 48 h. D, ELISA of C3 secretion into the culture medium by PBM-derived macrophages 48 h after treatment with BSA, native and modified LDL, or LXR agonist TO191317. E, the level of C3 mRNA in human THP-1-derived macrophages. Control, THP-1 cells incubated with BSA; acLDL and acLDL+ cells, acLDL-negative and positive THP-1-derived macrophages after cell sorting by acLDL content; real-time RT-PCR; 100% is the level in the control THP-1 macrophages. F, the level of C3 mRNA in human THP-1-derived macrophages. Control, THP-1 cells incubated with BSA (100%); AB&TLR4, TLR4-blocking antibodies; LPS, bacterial lipopolysaccharide, 100 ng/ml; real-time RT-PCR. Cells were treated with or without BSA (50 μg/ml), acetylated BSA (50 μg/ml), native LDL (50 μg/ml), acLDL (50 μg/ml), oxLDL (50 μg/ml), LPS (100 ng/ml), or TO191317 (TO; 2.5 μm) for 48 h. Values are presented as means ± S.E. (error bars) of six independent experiments. The statistical analyses of differences between compared groups were performed using an unpaired Student's t test (*, p < 0.05; **, p < 0.01) or Dunnett's criterion (#, p < 0.05). n.s., not significant.
FIGURE 2.
FIGURE 2.
LXRβ binds LXRE within the human C3 promoter in human macrophages. A, the sequence of LXRE in the human C3 promoter (wild type (hC3-LXRE wt) and mutated (hC3-LXRE mut) LXRE in the human C3 promoter). Sequences of the region of the mouse and the human C3 promoter corresponding to LXRE in the human C3 promoter are shown. B, electrophoretic mobility shift assay of the human macrophage nuclear extract proteins with hC3-LXRE. Shown are a biotin-labeled (Biot.) and biotin-unlabeled (No Biot.) probe containing hC3-LXRE and flanking regions and a DNA-protein complex (C). C and D, DNA affinity precipitation assay using THP-1-derived (C) or PBM-derived (D) macrophage nuclear extract proteins and biotin-labeled probe containing hC3-LXRE followed by Western blot analysis of precipitated proteins using antibodies against LXRβ. E, the level of C3 mRNA in mouse peritoneal macrophages (PM); real-time RT-PCR; 100% is the level in the control peritoneal macrophages. Cells were treated with or without TO191317 (TO; 2.5 μm) or oxLDL (50 μg/ml) for 48 h. F, level of C3 mRNA in human HepG2 cells; real-time RT-PCR; 100% is the level in the control HepG2 cells. Cells were treated with or without TO191317 (2.5 μm) for 48 h. Values are presented as means ± S.E. of six independent experiments. G, ChIP assay with PBM- and THP-1-derived macrophages and HepG2 cells. C3 LXRE, LXRE in the human C3 promoter; ABCA1 LXRE, LXRE in the human ABCA1 promoter; NOD1, the sequence in the human NOD1 gene (specificity control). M, molecular weight marker; AB&LXRβ, antibodies against LXRβ; AB&Actin, antibodies against β-actin. H, luciferase assay of plasmids containing a fragment of the human C3 promoter with (pC3(−463/+268)-Luc) or without (pC3(−310/+268)-Luc) LXRE transfected into THP-1 monocytes and THP-1-derived macrophages treated with or without TO191317 (2.5 μm) for 24 h. Values are presented as means ± S.E. (error bars) of four independent experiments. The statistical analyses of differences between compared groups were performed using an unpaired Student's t test (*, p < 0.05) or Dunnett's criterion (#, p < 0.05). n.s., not significant.
FIGURE 3.
FIGURE 3.
C3 transcription and secretion under the impact of mLDL and NF-κB or MAPK inhibitors in human macrophages. A and B, ELISA of C3 protein content in PBM-derived macrophage lysates (A) and in the culture medium (B). Cells were incubated with or without LXR agonist TO191317 (TO; 2.5 μm) for 24 or 48 h. C, ELISA of C3 protein content in the culture medium of PBM-derived macrophages; cells were treated with or without oxLDL (50 μg/ml, 48 h) and TLR4-specific blocking antibodies (AB&TLR4; 1 μg/ml). D, ELISA of C3 protein content in the culture medium of THP-1-derived macrophages; cells were treated with or without oxLDL or acLDL (50 μg/ml, 48 h) and TLR4-specific blocking antibodies (1 μg/ml). E, the level of C3 mRNA in human THP-1-derived macrophages; 100% is the level in the control THP-1 cells (untreated with inhibitors). F and G, ELISA of C3 protein content in the culture medium (F) and cell lysates (G) of THP-1-derived macrophage. Control, THP-1 cells untreated with inhibitors. Cells were treated with SB203580 (p38 inhibitor) (25 μm) (p38 inh), SP600125 (JNK1/2/3 inhibitor) (10 μm) (JNK inh), U0126 (MEK1/2 inhibitor) (10 μm) (MEK inh), QNZ (NF-κB inhibitor) (10 nm) (NF-κB inh), and BSA (50 μg/ml) or oxLDL (50 μg/ml) for 48 h. Values are presented as means ± S.E. (error bars) of six independent experiments. The statistical analyses of differences between compared groups were performed using an unpaired Student's t test (*, p < 0.05; **, p < 0.01) or Dunnett's criterion (#, p < 0.05).
FIGURE 4.
FIGURE 4.
C3 transcription and secretion and surface expression of CD14 and TLR4 are differently regulated by oxLDL and LXR agonist TO191317 in human resting and classically (M1) and alternatively (M2) activated PBM-derived macrophages. A and B, the level of C3 mRNA (A) determined by real-time RT-PCR and C3 secretion (B) determined by ELISA in resting or classically or alternatively activated PBM-derived macrophages 0–48 h after the addition of oxLDL (50 μg/ml). C, level of C3 mRNA determined by real-time RT-PCR in resting or classically or alternatively activated PBM-derived macrophages 0–48 h after the addition of LXR agonist TO191317 (TO; 2.5 μm). D, the level of C3 mRNA in human PBM-derived macrophages; real-time RT-PCR; 100% is the level in the resting macrophages treated with BSA. E, ELISA of C3 protein content in the culture medium of PBM-derived macrophages. Values are presented as means ± S.E. (error bars) of six independent experiments. The statistical analyses of differences were performed separately for values in RM, M1, or M2 groups using an unpaired Student's t test (*, p < 0.05) or Dunnett's criterion (for comparison of RM, M1, and M2) (#, p < 0.05). F, level of CD14 mRNA in human PBM-derived macrophages; real-time RT-PCR; 100% is the level in the resting macrophages treated with BSA. G, FACS analysis of surface CD14 expression in human PBM-derived macrophages; the percentage of CD14+ cells is indicated. H, level of TLR4 mRNA in human PBM-derived macrophages; real-time RT-PCR; 100% is the level in the resting macrophages. I, FACS analysis of surface TLR4 expression in human PBM-derived macrophages. Medians of surface TLR4 expression are indicated. Values are presented as means ± S.E. of six independent experiments. The statistical analyses of differences between compared groups were performed using Dunnett's criterion (#, p < 0.05). PBM-derived macrophages were treated with BSA (20 ng/ml) (RM), with IFNγ (20 ng/ml) and bacterial LPS (100 ng/ml) (M1) or IL-4 (20 ng/ml) (M2) for 6 days. Cells were treated with oxLDL (50 μg/ml) and/or LXR agonist TO191317 (2.5 μm) and/or LPS (100 ng/ml) for 0–48 h.
FIGURE 5.
FIGURE 5.
TNFα expression and secretion by human resting and classically (M1) and alternatively (M2) activated PBM-derived macrophages. A and B, level of TNFα mRNA (A) determined by real-time RT-PCR and TNFα secretion (B) determined by ELISA in resting and classically or alternatively activated PBM-derived macrophages 0–48 h after the addition of oxLDL (50 μg/ml). C and D, the level of TNFα mRNA (C) determined by real-time RT-PCR and TNFα secretion (D) determined by ELISA in resting and classically or alternatively activated PBM-derived macrophages 0–48 h after the addition of LXR agonist TO191317 (TO; 2.5 μm). E, level of TNFα mRNA in human PBM-derived macrophages; real-time RT-PCR; 100% is the level in the macrophages treated with BSA. F, ELISA of TNFα protein content in the culture medium of PBM-derived macrophages. PBM-derived macrophages were treated with BSA (20 ng/ml) (RM), with IFNγ (20 ng/ml) and bacterial LPS (100 ng/ml) (M1) or IL-4 (20 ng/ml) (M2) for 6 days. Cells were treated with oxLDL (50 μg/ml) and/or LXR agonist TO191317 (2.5 μm) and/or LPS (100 ng/ml) for 48 h. Values are presented as means ± S.E. (error bars) of six independent experiments. The statistical analyses of differences were performed separately for values in the RM, M1, or M2 group using an unpaired Student's t test (*, p < 0.05) or Dunnett's criterion (for comparison of RM, M1, and M2) (#, p < 0.05).
FIGURE 6.
FIGURE 6.
C3a stimulates oxLDL uptake and C3 expression and secretion by human PBM-derived macrophages in vitro. A, FACS analysis of FITC-labeled oxLDL accumulation (50 μg/ml; 48 h) in PBM-derived macrophages treated with or without C3a (10 nm). C3a (10 nm) was added to the cells (at the 4th day of differentiation) at the same time as oxLDL (shown as C3a 2 days) or 2 days before and with oxLDL (at the 2nd and 4th days of differentiation) (shown as C3a 4 days). Medians of fluorescence are indicated. B–D, the level of C3 mRNA (B) determined by real-time RT-PCR and secreted (C) and intracellular (D) C3 protein determined by ELISA in human PBM-derived macrophages treated with C3a (10 nm) for 0–72 h. E and F, level of C3 mRNA (E) determined by real-time RT-PCR and secreted C3 (F) determined by ELISA in human PBM-derived macrophages treated with or without C3a (10 nm), oxLDL (50 μg/ml), or bacterial LPS (100 ng/ml) for 48 h. Values are presented as means ± S.E. (error bars) of five independent experiments. The statistical analyses of differences between compared groups were performed using an unpaired Student's t test (*, p < 0.05) or Dunnett's criterion (#, p < 0.05).
FIGURE 7.
FIGURE 7.
Hypothetical scheme illustrating a possible mechanism of mLDL-mediated regulation of C3 expression and secretion by human macrophages. mLDL is taken up by macrophage, which results in intracellular oxidized cholesterol accumulation. Oxidized cholesterol (LXR ligand) activates C3 gene transcription via LXR interacting with LXRE inside the human C3 gene promoter. Interaction of mLDL with CD14 and TLR4 stimulates both C3 gene transcription (via the MEK1/2-ERK1/2 signaling pathway) and C3 protein secretion (via NF-κB activation) by macrophage. Produced as a result of complement activation, anaphylatoxin C3a interacts with C3a receptor (C3aR) and promotes C3 transcription and mLDL uptake by macrophage. The arrows show activation, and the dotted line arrows show transport of C3 and C3 cleavage products inside or outside of the cell. For a further explanation, see “Results” and “Discussion.”

Similar articles

Cited by

References

    1. Walport M. J. (2001) Complement. First of two parts. N. Engl. J. Med. 344, 1058–1066 - PubMed
    1. Klos A., Tenner A. J., Johswich K. O., Ager R. R., Reis E. S., Köhl J. (2009) The role of the anaphylatoxins in health and disease. Mol. Immunol. 46, 2753–2766 - PMC - PubMed
    1. Ricklin D., Hajishengallis G., Yang K., Lambris J. D. (2010) Complement: A key system for immune surveillance and homeostasis. Nat. Immunol. 11, 785–797 - PMC - PubMed
    1. Alper C. A., Johnson A. M., Birtch A. G., Moore F. D. (1969) Human C3. Evidence for the liver as the primary site of synthesis. Science 163, 286–288 - PubMed
    1. Einstein L. P., Hansen P. J., Ballow M., Davis A. E., 3rd, Davis J. S., 4th, Alper C. A., Rosen F. S., Colten H. R. (1977) Biosynthesis of the third component of complement (C3) in vitro by monocytes from both normal and homozygous C3-deficient humans. J. Clin. Invest. 60, 963–969 - PMC - PubMed

Publication types

MeSH terms