. 2012 Feb 3;110(3):416-27.
doi: 10.1161/CIRCRESAHA.111.253377. Epub 2011 Dec 22.

NR4A1 (Nur77) deletion polarizes macrophages toward an inflammatory phenotype and increases atherosclerosis

Affiliations

NR4A1 (Nur77) deletion polarizes macrophages toward an inflammatory phenotype and increases atherosclerosis

Richard N Hanna et al. Circ Res. .

Abstract

Rationale: NR4A1 (Nur77) is a nuclear receptor that is expressed in macrophages and within atherosclerotic lesions, yet its function in atherosclerosis is unknown.

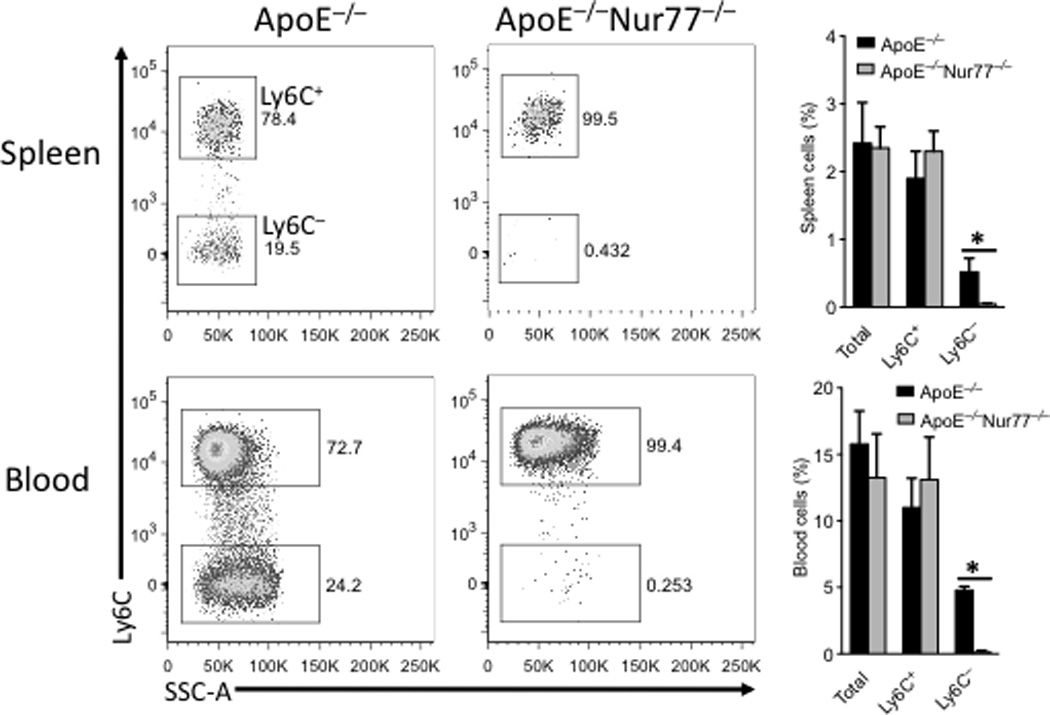
Objective: Nur77 regulates the development of monocytes, particularly patrolling Ly6C(-) monocytes that may be involved in resolution of inflammation. We sought to determine how absence of nuclear receptor subfamily 4, group A, member 1 (NR4A1) in hematopoietic cells affected atherosclerosis development.

Methods and results: Nur77(-/-) chimeric mice on a Ldlr(-/-) background showed a 3-fold increase in atherosclerosis development when fed a Western diet for 20 weeks, despite having a drastic reduction in Ly6C(-) patrolling monocytes. In a second model, mice deficient in both Nur77 and ApoE (ApoE(-/-)Nur77(-/-)) also showed increased atherosclerosis after 11 weeks of Western diet. Atherosclerosis was associated with a significant change in macrophage polarization toward a proinflammatory phenotype, with high expression of tumor necrosis factor-α and nitric oxide and low expression of Arginase-I. Moreover, we found increased expression of toll-like receptor 4 mRNA and protein in Nur77(-/-) macrophages as well as increased phosphorylation of the p65 subunit of NFκB. Inhibition of NFκB activity blocked excess activation of Nur77(-/-) macrophages.

Conclusions: We conclude that the absence of Nur77 in monocytes and macrophages results in enhanced toll-like receptor signaling and polarization of macrophages toward a proinflammatory M1 phenotype. Despite having fewer monocytes, Nur77(-/-) mice developed significant atherosclerosis when fed a Western diet. These studies indicate that Nur77 is a novel target for modulating the inflammatory phenotype of monocytes and macrophages and may be important for regulation of atherogenesis.


Figures

Figure 1
Figure 1. Increased atherosclerotic plaque area in ApoE−/−Nur77−/− mice
(A) Quantification of plaque area as % of aortic surface in ApoE−/− Nur77−/− mice and ApoE−/− control mice after 11 weeks of Western diet feeding. P < 0.01 (Mann-Whitney test) (B) Representative Oil Red O staining (red) in aortic arches of ApoE−/−Nur77−/− mice and ApoE−/− control mice after 11 weeks of Western diet feeding. (C) Quantification of aortic root lesion area in ApoE−/− Nur77−/− mice and ApoE−/− control mice after 11 weeks of Western diet feeding. P < 0.02 (Student’s t-test) (D) Oil Red O (red, top) and CD68+ macrophage (green, bottom) staining of aortic root sections from ApoE−/− (left) and ApoE−/−Nur77−/− (right) mice on 11 weeks of Western diet feeding under low magnification (10x, left panel of each group) and high magnification (40x, right panel of each group). (E) Quantification of Oil Red O (left) and macrophage (CD68, right) staining expressed as percentage of total plaque area. *P < 0.05 (unpaired Student’s t-test) Data are representative of two independent experiments (n = 12 per group A and B, n = 7 per group for C, and n=10 per group D and E; mean and s.e.m).
Figure 2
Figure 2. Reduction in the Ly6C monocyte population in ApoE−/−Nur77−/− mice fed a Western diet
Representative flow scatterplots of Ly6C+ and Ly6C monocyte populations in the spleen and blood of ApoE−/−Nur77−/− mice and ApoE−/− control mice after 11 weeks of Western diet feeding (left). Numbers next to gates show percentages of cell population in plot. Quantification of Ly6C+ and Ly6C monocyte populations as a percentage of all live cells in the spleen and blood (right). *P < 0.01 (unpaired Student’s t-test). Data are representative of two independent experiments (n = 8 per group; mean and s.e.m.)
Figure 3
Figure 3. Increased atherosclerotic plaque area and macrophage content in Nur77−/− bone marrow transplanted mice
Ldlr−/− recipient mice were reconstituted for six weeks with either Nur77−/− or Nur77+/+ (WT) bone marrow before being fed a Western diet for 20 weeks. (A) Quantification of plaque area as % of aortic surface in Ldlr−/− mice receiving Nur77−/− bone marrow (Nur77−/−) and Ldlr−/− mice receiving C57BL/6J control bone marrow (WT) after 20 weeks of Western diet feeding. P < 0.001 (Mann-Whitney test). (B) Representative Oil Red O staining of plaques (red) in aortic arches of Ldlr−/− mice receiving Nur77−/−bone marrow (Nur77−/−) and Ldlr−/− mice receiving C57BL/6J control bone marrow (WT). (C) Representative flow plot of CD11b+F4/80+ macrophages in aortas of Ldlr−/− mice receiving Nur77−/−bone marrow (Nur77−/−) and Ldlr−/− mice receiving C57BL/6J control bone marrow (WT) after Western diet feeding as measured by flow cytometry after gating on live CD45+ cells (left). Quantification of CD11b+F4/80+ macrophages in aorta after BMT and Western diet feeding as measured by flow cytometry (right). *P < 0.01 (unpaired Student’s t-test). Data are representative of four independent experiments (n = 15 per group in A and B, n = 4 per group in C).
Figure 4
Figure 4. TNFα production and induction of Nur77 in Ly6C+ monocytes
(A) Sorted Ly6C+ monocytes from ApoE−/− (WT) and ApoE−/−Nur77−/− (Nur77−/−) mice were cultured for 18 hours in the absence (UN) or presence of 50 ng/ml LPS (LPS). Cells were stained intracellularly for TNFα and analyzed by flow cytometry. Data are expressed as fold change in TNF mean fluorescent intensity over Ly6C+ WT monocytes set as 1. Data are representative of two independent experiments (n = 3 per group; mean and s.e.m.) *P < 0.01 (unpaired Student’s t-test). (B) Induction of Nr4A1 family members Nur77, NOR1 and Nurr1 in C57BL/6J control Ly6C+ blood monocytes in response to LPS (100 ng/ml) stimulation for 1.5 hours (n = 4 per group; mean and s.e.m.) *P < 0.001 (unpaired Student’s t-test). Quantification of data expressed as percent change in mRNA of LPS treated over untreated expression for each gene set as 100%. (C) Isolated Nur77-GFPlowCD11b+Ly6C+ inflammatory monocytes with almost no initial GFP expression (Untreated), achieved increased GFP expression after 2 hours incubation on plastic. Inflammatory Nur77-GFPlowCD11b+Ly6C+ monocytes were sorted from blood using a FACS Aria II cell sorter, and isolated cells were incubated for 2 hours at 37° C, 5% CO2 on a plastic surface. Negative control is the same monocyte population from a GFP mouse. Data are representative of three independent experiments.
Figure 5
Figure 5. Increased lipid accumulation in Ly6C+ cells from Nur77−/− mice
Ldlr−/− recipient mice were reconstituted for six weeks with either Nur77−/− or Nur77+/+ (WT) bone marrow before being placed on Western diet for 20 weeks. (A) Representative histogram (left) and quantification (right) of Nile Red staining (neutral lipid content) by FACS in blood Ly6C+ monocytes from Ldlr−/−Nur77−/− (Nur77−/−, blue) or Ldlr−/− control (WT, red) mice after 20 weeks of Western diet feeding. Data are expressed as fold change in Nile Red mean fluorescent intensity over Ly6C+ WT monocytes set as 1. (B) Change in scavenger receptor CD36 and SRAI/II surface expression in Ly6C+ monocytes isolated from bone marrow (BM), blood and spleen of Ldlr−/− (WT) and Ldlr−/−Nur77−/− mice measured by flow cytometry. Data are expressed as fold change in receptor mean fluorescent intensity over Ly6C+ WT bone marrow monocytes set as 1. (C) Uptake of Dil-OxLDL by CD115+CD11b+ splenocytes from Ldlr−/−Nur77−/− (Nur77−/−) or Ldlr−/− control (WT) mice detected by flow cytometry. Isolated splenocytes from Ldlr−/− bone marrow transplant mice on high fat diet for 20 weeks were incubated overnight with 10 µg/ml Dil-OxLDL. Quantification of data expressed as fold change in Nile Red mean fluorescent intensity over CD115+CD11b+ WT myeloid cells set as 1 (left). Representative staining of Dil-OxLDL (red) uptake and DAPI (blue) in CD115+CD11b+ cells (right). *P < 0.01 (unpaired Student’s t-test). Data are representative of three independent experiments (n = 4 per grouping a–c; mean and s.e.m.).
Figure 6
Figure 6. Increased inflammatory phenotype and Oxidized-LDL uptake of macrophages from Nur77−/− mice
(A) IL-10, IL-12, Arginase (Arg1), TNFα (TNF), iNOS, and TGFβ1 mRNA production in peritoneal macrophages from ApoE−/−Nur77−/− (Nur77−/−) mice and ApoE−/− control (WT) mice fed a Western diet for 11 weeks (left) and after stimulation for 2 hours with 30 µg/ml KLA (right). Quantification of data expressed as percent change in Nur77−/− mRNA over WT expression for each gene. (B) Representative flow scatter plot (left) and quantification (right) of MHCII expression in peritoneal macrophages from ApoE−/−Nur77−/− (Nur77−/−) mice and ApoE−/− control (WT) mice after 11 weeks of Western diet feeding. Quantification of data expressed as fold change in MHCII mean fluorescent intensity over WT macrophages set as 1. (C) Bone marrow-derived macrophages from Nur77−/− and wild-type control (WT) mice were incubated with Dil-OxLDL for 6h , and then analyzed for uptake of Oxidized-LDL (OxLDL) using FACS. (D) Measurement of TNFα (TNF), CD36 and SRA-1 mRNA expression in F4/80+ macrophages sorted from aortae of ApoE−/−Nur77−/− (Nur77−/−) mice and ApoE−/− control (WT) mice after 11 weeks of Western diet feeding. Quantification of data expressed as percent change in Nur77−/− mRNA over WT expression for each gene. *P < 0.01 (unpaired Student’s t-test) Data are representative of three independent experiments (n =6 a,b and n=3 c,d per grouping; mean and s.e.m.).
Figure 7
Figure 7. Increased TLR expression and NFκB mediated inflammatory cytokine production by Nur77−/− macrophages
(A) Expression of TLR2, 4, 7 and 9 mRNA levels in peritoneal macrophages from ApoE−/−Nur77−/− (Nur77−/−) mice and ApoE−/− control (WT) mice on chow (left), after 11 weeks of Western diet feeding (center) or after Western diet feeding with incubation for an additional 2 hours with 30 µg/ml KLA (right). Quantification of data expressed as percent change in Nur77−/− mRNA over WT expression for each gene. (B) Representative flow plot (left) and quantification (right) of TLR4-MD2 expression on peritoneal macrophages from ApoE−/−Nur77−/− (Nur77−/−) mice and ApoE−/− control (WT) mice measured by flow cytometry. Quantification of data expressed as fold change in TLR4-MD2 mean fluorescent intensity over WT macrophages set as 1; *p<0.01. (C) IL-12, TNFα (TNF), iNOS, and Arginase (Arg1) mRNA expression in peritoneal macrophages from Nur77−/− mice and C57BL/6J wildtype control (WT) mice on chow diet, unstimulated (UN) or stimulated for 2 or 24 hours with 30 µg/ml KLA (right) measured by quantitative real-time PCR. Quantification of data expressed as percent change in mRNA over untreated WT expression for each gene. (D) TNFα, IL-12, and nitric oxide production in production by peritoneal macrophages from Nur77−/− mice and C57BL/6J wild-type control (WT) mice on chow diet, unstimulated (UN) or stimulated for 18 hours with either 30 µg/ml KLA, 5 µg/ml R848, or 30 ng/ml PAM2. TNFα and IL-12 proteins were measured by ELISA, and nitric oxide was measured by the Griess assay. (E) Intracellular staining of p65 activation in peritoneal macrophages from Nur77−/− mice and C57BL/6J wild-type control (WT) mice on chow diet unstimulated (UN) or stimulated for 2 hours with either 30 µg/ml KLA by flow cytometry using a p65 phosphoserine 529 (pS529) antibody. Data are representative of two independent experiments (F) IL-12, iNOS and TNFα mRNA expression in peritoneal macrophages from Nur77−/− mice and wild-type control (WT) mice unstimulated (UN), pretreated for 1 hour with the NFκB inhibitor Bay11-7082 (Bay), stimulated with 100 ng/ml LPS (LPS) for 2 hours, or stimulated with LPS after Bay11-7082 pretreatment (LPS+Bay), measured by quantitative real-time PCR. Quantification of RNA data expressed as percent change in Nur77−/− mRNA over WT expression for each gene. (G) Quantification of TNFα protein levels secreted in media by peritoneal macrophages treated under same conditions as in A. *P < 0.01 (unpaired Student’s t-test) (n =6 per group; mean and s.e.m.). (n =6 a–c,f,g; d and e n=4 per grouping; mean and s.e.m.).
Figure 8
Figure 8. CD14dimCD16+ human monocytes express high levels of Nur77
Monocytes were isolated from human blood of normal donors, and monocytes isolated by cell sorting using CD14 and CD16 antibodies. (A) representative scatter plot of human blood monocyte populations based on CD14 and CD16 expression (B) Quantification of mRNA expression for CCL3 and Nur77 in the three human monocyte subsets, ***p<0.0001 by ANOVA.

Comment in

References

    1. Martinez-Gonzalez J, Badimon L. The nr4a subfamily of nuclear receptors: New early genes regulated by growth factors in vascular cells. Cardiovasc Res. 2005;65:609–618. - PubMed
    1. Wang Z, Benoit G, Liu J, Prasad S, Aarnisalo P, Liu X, Xu H, Walker NP, Perlmann T. Structure and function of nurr1 identifies a class of ligand-independent nuclear receptors. Nature. 2003;423:555–560. - PubMed
    1. Pols TW, Bonta PI, de Vries CJ. Nr4a nuclear orphan receptors: Protective in vascular disease? Curr Opin Lipidol. 2007;18:515–520. - PubMed
    1. Bonta PI, Pols TW, de Vries CJ. Nr4a nuclear receptors in atherosclerosis and vein-graft disease. Trends Cardiovasc Med. 2007;17:105–111. - PubMed
    1. Pei L, Castrillo A, Chen M, Hoffmann A, Tontonoz P. Induction of nr4a orphan nuclear receptor expression in macrophages in response to inflammatory stimuli. J Biol Chem. 2005;280:29256–29262. - PubMed

Publication types

MeSH terms