

Ancestral components of admixed genomes in a Mexican cohort
- PMID: 22194699
- PMCID: PMC3240599
- DOI: 10.1371/journal.pgen.1002410
Ancestral components of admixed genomes in a Mexican cohort
Abstract
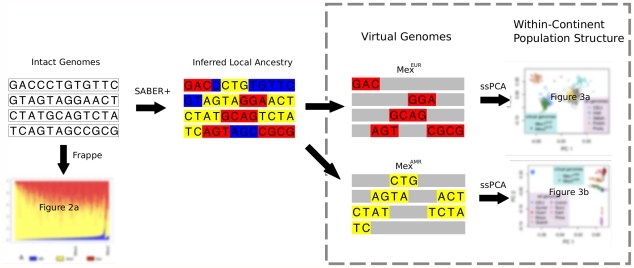
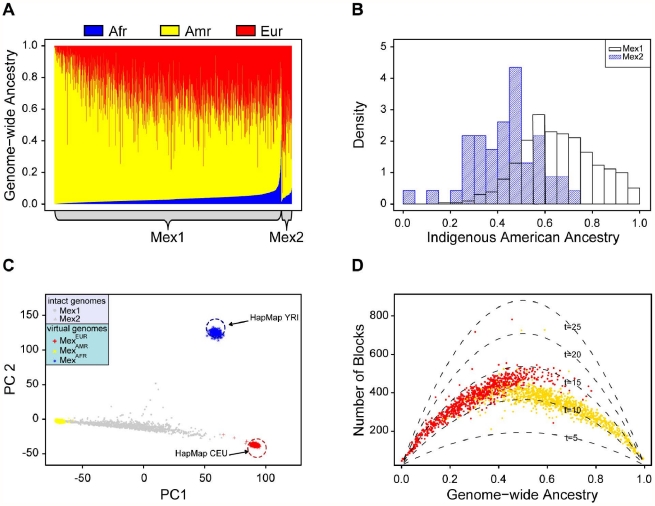
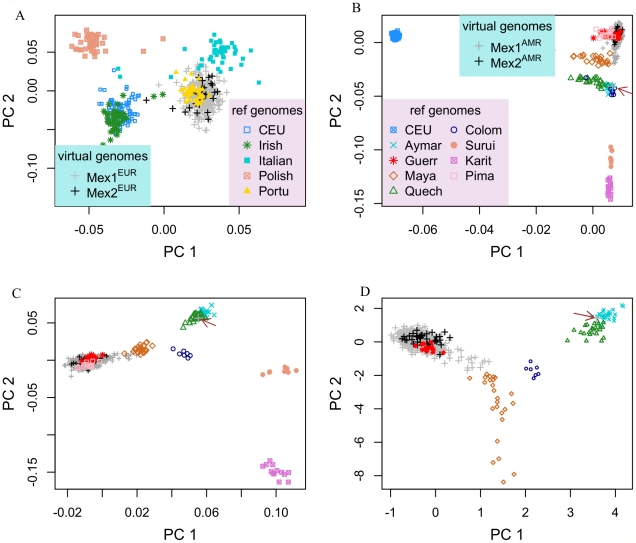
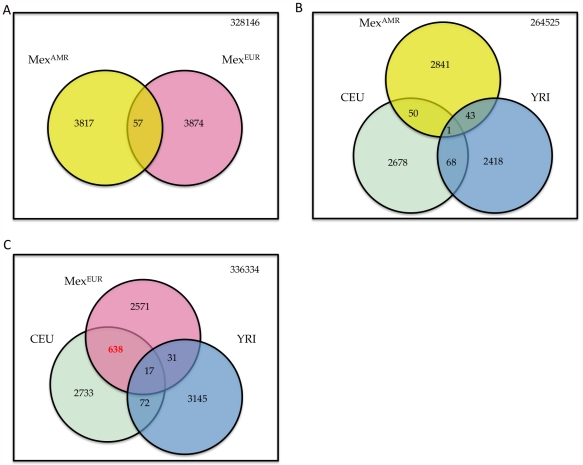
For most of the world, human genome structure at a population level is shaped by interplay between ancient geographic isolation and more recent demographic shifts, factors that are captured by the concepts of biogeographic ancestry and admixture, respectively. The ancestry of non-admixed individuals can often be traced to a specific population in a precise region, but current approaches for studying admixed individuals generally yield coarse information in which genome ancestry proportions are identified according to continent of origin. Here we introduce a new analytic strategy for this problem that allows fine-grained characterization of admixed individuals with respect to both geographic and genomic coordinates. Ancestry segments from different continents, identified with a probabilistic model, are used to construct and study "virtual genomes" of admixed individuals. We apply this approach to a cohort of 492 parent-offspring trios from Mexico City. The relative contributions from the three continental-level ancestral populations-Africa, Europe, and America-vary substantially between individuals, and the distribution of haplotype block length suggests an admixing time of 10-15 generations. The European and Indigenous American virtual genomes of each Mexican individual can be traced to precise regions within each continent, and they reveal a gradient of Amerindian ancestry between indigenous people of southwestern Mexico and Mayans of the Yucatan Peninsula. This contrasts sharply with the African roots of African Americans, which have been characterized by a uniform mixing of multiple West African populations. We also use the virtual European and Indigenous American genomes to search for the signatures of selection in the ancestral populations, and we identify previously known targets of selection in other populations, as well as new candidate loci. The ability to infer precise ancestral components of admixed genomes will facilitate studies of disease-related phenotypes and will allow new insight into the adaptive and demographic history of indigenous people.
Conflict of interest statement
The authors have declared that no competing interests exist.
Figures
References
-
- Rosenberg NA, Pritchard JK, Weber JL, Cann HM, Kidd KK, et al. Genetic structure of human populations. Science. 2002;298:2381–2385. - PubMed
-
- Li JZ, Absher DM, Tang H, Southwick AM, Casto AM, et al. Worldwide human relationships inferred from genome-wide patterns of variation. Science. 2008;319:1100–1104. - PubMed
-
- Wang S, Lewis CM, Jakobsson M, Ramachandran S, Ray N, et al. Genetic variation and population structure in native Americans. PLoS Genet. 2007;3:e185. doi: 10.1371/journal.pgen.0030185. - DOI - PMC - PubMed
Publication types
MeSH terms
Grants and funding
LinkOut - more resources
Full Text Sources
Other Literature Sources
