. 2011;6(12):e28425.
doi: 10.1371/journal.pone.0028425. Epub 2011 Dec 14.

Mould routine identification in the clinical laboratory by matrix-assisted laser desorption ionization time-of-flight mass spectrometry

Affiliations

Mould routine identification in the clinical laboratory by matrix-assisted laser desorption ionization time-of-flight mass spectrometry

Carole Cassagne et al. PLoS One. 2011.

Abstract

Background: MALDI-TOF MS recently emerged as a valuable identification tool for bacteria and yeasts and revolutionized the daily clinical laboratory routine. But it has not been established for routine mould identification. This study aimed to validate a standardized procedure for MALDI-TOF MS-based mould identification in clinical laboratory.

Materials and methods: First, pre-extraction and extraction procedures were optimized. With this standardized procedure, a 143 mould strains reference spectra library was built. Then, the mould isolates cultured from sequential clinical samples were prospectively subjected to this MALDI-TOF MS based-identification assay. MALDI-TOF MS-based identification was considered correct if it was concordant with the phenotypic identification; otherwise, the gold standard was DNA sequence comparison-based identification.

Results: The optimized procedure comprised a culture on sabouraud-gentamicin-chloramphenicol agar followed by a chemical extraction of the fungal colonies with formic acid and acetonitril. The identification was done using a reference database built with references from at least four culture replicates. For five months, 197 clinical isolates were analyzed; 20 were excluded because they were not identified at the species level. MALDI-TOF MS-based approach correctly identified 87% (154/177) of the isolates analyzed in a routine clinical laboratory activity. It failed in 12% (21/177), whose species were not represented in the reference library. MALDI-TOF MS-based identification was correct in 154 out of the remaining 156 isolates. One Beauveria bassiana was not identified and one Rhizopus oryzae was misidentified as Mucor circinelloides.

Conclusions: This work's seminal finding is that a standardized procedure can also be used for MALDI-TOF MS-based identification of a wide array of clinically relevant mould species. It thus makes it possible to identify moulds in the routine clinical laboratory setting and opens new avenues for the development of an integrated MALDI-TOF MS-based solution for the identification of any clinically relevant microorganism.


Conflict of interest statement

Competing Interests: The authors have declared that no competing interests exist.

Figures

Figure 1
Figure 1. MALDI TOF MS spectra obtained with the 5 extraction procedures.
(A) Gel view of the spectra of the Aspergillus fumigatus AFUM001strain obtained with the different extraction procedures. (B) List view of the spectra of the AFUM001obtained with the different extraction procedures. These procedures are detailed in the Material and Method section. The peaks obtained with procedure B, C and E were fewer and of lower intensity than those obtained with procedures A.
Figure 2
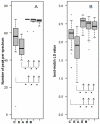
Figure 2. Comparison of the quality of spectra obtained from the 5 different extraction procedures.
(A) Box-and-whisker diagrams of the number of peaks per spectra of the 5 procedures. (B) Box-and-whisker diagrams of the best-match LS value of the 5 procedures. The bottom and top of the box are the lower and upper quartiles, respectively; the band near the middle of the box represents the median; and the ends of the whiskers represent the lowest datum still within 1.5 interquartile range (IQR) of the lower quartile and the highest datum still within 1.5 IQR of the upper quartile. Asterisks indicate which pairs of procedures were statistically different (Wilcoxon tests, p<10−3). Procedures A, B, and D displayed significantly more peaks (p<10−4) and higher best-match LS values (p<10−3) than procedures C and E. No statistically significantly difference was found between procedure C and E on the one han and between procedures A, B, D on the other hand.
Figure 3
Figure 3. Comparison of the technical and biological reproducibility between the procedure A, B and D.
(A) Box-and-whisker diagram of the best-match LS value obtained in the technical reproducibility test. (B) Box-and-whisker diagram of the best-match LS value obtained in the biological reproducibility test. The bottom and top of the box are the lower and upper quartiles, respectively; the dark band is the median; and the ends of the whiskers represent the lowest datum included in the 1.5 interquartile range (IQR) of the lower quartile and the highest datum included in the 1.5 IQR of the upper quartile). Asterisks indicate which pairs of procedures were statistically different (Wilcoxon tests, p<10−3). The pairwise matched Wilcoxon tests with Holm's adjustment for multiple comparisons indicated that the technical reproducibility was significantly better with procedure A than with procedures B and D (p<10−16 and p<10−12 respectively). Furthermore, the biological reproducibility with procedure B was significantly poorer than with procedure A (p<10−9).
Figure 4
Figure 4. Distribution of the best-match LS values recorded during the mass spectra library validation test.
The figure shows the best-match LS values for each of the 4 spots issued from a subculture of the 146 strains included in the library. The dark line represents the best-match LS values of the correct identification results whereas the gray line shows the best-match LS values of the misidentification results. The distributions of the best-match LS values for the spectra resulting either in a correct identification or a misidentification did almost not overlap.
Figure 5
Figure 5. Distribution of the best-match LS values issued from the identification of the clinical isolates.
This figure shows the distribution of the best-match LS values for each of the 4 spots issued from identification of the 156 clinical isolates. The dark line indicates the best-match LS values of the concordant spots whereas the gray line shows the best-match LS values of the discordant ones. Concordant and discordant spots best-match LS value distributions were almost distinct.

References

    1. Chabasse B. Emergence of new fungal pathogens: general review. Revue Francophone des Laboratoire. 2009;416:71–87.
    1. Tang CM, Holden DW, Aufauvre-Brown A, Cohen J. The detection of Aspergillus spp. by the polymerase chain reaction and its evaluation in bronchoalveolar lavage fluid. Am Rev Respir Dis. 1993;148:1313–1317. - PubMed
    1. Alexander BD. Diagnosis of fungal infection: new technologies for the mycology laboratory. Transpl Infect DisSuppl. 2002;3:32–37. - PubMed
    1. Balajee SA, Sigler L, Brandt ME. DNA and the classical way: identification of medically important molds in the 21st century. Med Mycol. 2007;45:475–490. - PubMed
    1. Hsiao CR, Huang L, Bouchara J, Barton R, Li HC, et al. Identification of medically important molds by an oligonucleotide array. J Clin Microbiol. 2005;43:3760–3768. - PMC - PubMed

MeSH terms