. 2011;6(12):e28536.
doi: 10.1371/journal.pone.0028536. Epub 2011 Dec 15.

Galactose enhances oxidative metabolism and reveals mitochondrial dysfunction in human primary muscle cells

Affiliations

Galactose enhances oxidative metabolism and reveals mitochondrial dysfunction in human primary muscle cells

Céline Aguer et al. PLoS One. 2011.

Erratum in

  • PLoS One. 2012;7(1). doi:10.1371/annotation/4a3c143c-7338-4ed3-8fc4-a21526fd05a6
  • PLoS One. 2012;7(1). doi:10.1371/annotation/eb51f7a7-a8fd-45a3-9df0-e6080c47fe06

Abstract

Background: Human primary myotubes are highly glycolytic when cultured in high glucose medium rendering it difficult to study mitochondrial dysfunction. Galactose is known to enhance mitochondrial metabolism and could be an excellent model to study mitochondrial dysfunction in human primary myotubes. The aim of the present study was to 1) characterize the effect of differentiating healthy human myoblasts in galactose on oxidative metabolism and 2) determine whether galactose can pinpoint a mitochondrial malfunction in post-diabetic myotubes.

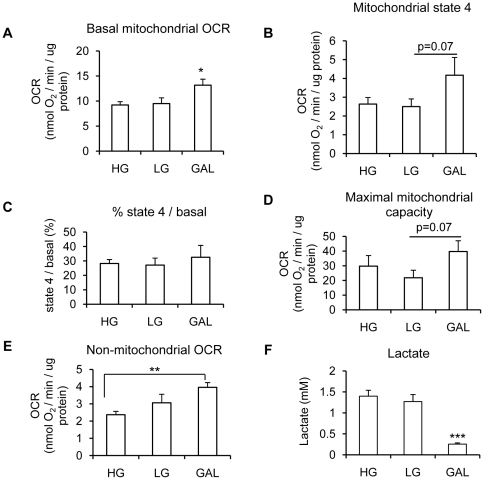
Methodology/principal findings: Oxygen consumption rate (OCR), lactate levels, mitochondrial content, citrate synthase and cytochrome C oxidase activities, and AMPK phosphorylation were determined in healthy myotubes differentiated in different sources/concentrations of carbohydrates: 25 mM glucose (high glucose (HG)), 5 mM glucose (low glucose (LG)) or 10 mM galactose (GAL). Effect of carbohydrates on OCR was also determined in myotubes derived from post-diabetic patients and matched obese non-diabetic subjects. OCR was significantly increased whereas anaerobic glycolysis was significantly decreased in GAL myotubes compared to LG or HG myotubes. This increased OCR in GAL myotubes occurred in conjunction with increased cytochrome C oxidase activity and expression, as well as increased AMPK phosphorylation. OCR of post-diabetic myotubes was not different than that of obese non-diabetic myotubes when differentiated in LG or HG. However, whereas GAL increased OCR in obese non-diabetic myotubes, it did not affect OCR in post-diabetic myotubes, leading to a significant difference in OCR between groups. The lack of an increase in OCR in post-diabetic myotubes differentiated in GAL was in relation with unaltered cytochrome C oxidase activity levels or AMPK phosphorylation.

Conclusions/significance: Our results indicate that differentiating human primary myoblasts in GAL enhances aerobic metabolism. Because this cell culture model elicited an abnormal response in cells from post-diabetic patients, it may be useful in further studies of the molecular mechanisms of mitochondrial dysfunction.


Conflict of interest statement

Competing Interests: The authors have declared that no competing interests exist.

Figures

Figure 1
Figure 1. Effect of replacing a glucose medium with a galactose medium on myotube differentiation, redox environment and ATP content.
A. Fusion index was measured in myotubes differentiated in HG (25 mM glucose), LG (5 mM glucose) or GAL (10 mM galactose) media for 7 days. The fusion index has been measured as the number of nuclei in differentiated myotubes (>2 myonuclei) as the percentage of the total number of nuclei in muscle cells (determined by a desmin immunofluorescence staining). Data are shown as mean ± SEM, n = 3. B. Myotube differentiation was assessed by Troponin T expression after 7 days of differentiation in HG (25 mM glucose), LG (5 mM glucose) or GAL (10 mM galactose) media. Top panel: representative Western blot of Troponin T expression in myotubes differentiated for 7 days in HG (25 mM glucose), LG (5 mM glucose) or GAL (10 mM galactose). Beta-actin was used as a loading control. Bottom panel: quantification by densitometry of Troponin T expression. Results are normalized to beta-actin expression. Data are shown as mean ± SEM, n = 4. *, p<0.05, LG and GAL vs HG. C. Myotube redox environment in response to differentiation in HG (25 mM glucose), LG (5 mM glucose) or GAL (10 mM galactose) was assessed using the MTT assay as described in the Methods section. Data are presented as mean ±SEM, n = 3, in which each condition was assessed in 6 replicates. D. ATP content in myotubes differentiated for 7 days in HG (25 mM glucose), LG (5 mM glucose) or GAL (10 mM galactose). Results are presented as means ± SEM, n = 4, in which each condition was assessed in duplicate.
Figure 2
Figure 2. Effect of replacing a glucose medium with a galactose medium on myotube aerobic capacity.
A. Basal mitochondrial oxygen consumption rate. *, p<0.05, GAL vs HG and LG. B. State 4 respiration (leak-dependent; non-phosphorylating). After basal oxygen consumption rate measurement, cells were treated with oligomycin (600 ng/ml) to determine state 4 respiration. p = 0.06, GAL vs LG. C. Percentage of basal OCR due to proton leak was calculated from the data shown in Figure 2A and B. Data are presented as means ± SEM, n = 7, in which each condition was assessed in 5–6 replicates. D. Maximal mitochondrial oxygen consumption capacity. After basal and state 4 respiration measurements, cells were treated with FCCP (1 µM) to determine maximal oxygen consumption. *, p<0.05, GAL vs LG. E. Non-mitochondrial oxygen consumption rate. After basal, state and maximal respiration measurements, cells were treated with antimycin (4 µM) to determine non-mitochondrial oxygen consumption. **, p<0.01, GAL vs LG. F. Lactate concentration in the extracellular media of myotubes differentiated for 7 days in HG (25 mM glucose), LG (5 mM glucose) or GAL (10 mM galactose). Results are presented as means ± SEM, n = 7, in which each condition was assessed in duplicate. ***, p<0.0001, GAL vs HG and LG.
Figure 3
Figure 3. Effect of replacing a glucose medium with a galactose medium on mitochondrial markers.
A. Mitochondrial yield measured in myotubes differentiated for 7 days in HG (25 mM glucose), LG (5 mM glucose) or GAL (10 mM galactose). Mitochondrial yield was determined as mitochondrial protein content per total cellular protein content. Results are presented as means ± SEM, n = 6, in which each condition was assessed in duplicate. B. Cardiolipin staining in myotubes differentiated for 7 days in HG (25 mM glucose), LG (5 mM glucose) or GAL (10 mM galactose). Cardiolipin was stained with 10N-nonyl acridine orange (NAO, 1 µM) in fixed myotubes for 30 min. The intensity of the staining was then measured by fluorescence. Results are presented as means ± SEM, n = 3. C. Citrate synthase activity measured on isolated mitochondria from myotubes differentiated for 7 days in HG (25 mM glucose), LG (5 mM glucose) or GAL (10 mM galactose). Results are presented as means ± SEM, n = 5, in which each condition was assessed in duplicate. D. Left panel: representative Western blot of Complex III and SDHA expression in myotubes differentiated for 7 days in HG (25 mM glucose), LG (5 mM glucose) or GAL (10 mM galactose). Complex III and SDHA were used as a mitochondrial content marker and beta-actin as a loading control. Right panels: quantification by densitometry of complex III and SDHA expressions. Data are presented normalized to beta-actin expression. Data are shown as mean ±SEM, n = 4. E. Cytochrome C oxidase activity measured in isolated mitochondria from myotubes differentiated for 7 days in HG (25 mM glucose), LG (5 mM glucose) or GAL (10 mM galactose). Results are presented as means ± SEM, n = 5, in which each condition was assessed in duplicate. *, p<0.05, GAL vs HG and LG. F. Top panel: representative Western blot of Complex IV expression in myotubes differentiated for 7 days in HG (25 mM glucose), LG (5 mM glucose) or GAL (10 mM galactose). Beta-actin was used as a loading control. Bottom panel: quantification by densitometry of complex IV expression. Data are presented normalized to beta-actin expression. Data are shown as mean ±SEM, n = 4. *, p<0.05, GAL vs HG and LG. G. Left panel: representative Western blot of P-AMPK expression in myotubes differentiated for 7 days in HG (25 mM glucose), LG (5 mM glucose) or GAL (10 mM galactose). Beta-actin and AMPKα2 were used as loading controls. Right panels: quantification by densitometry of P-AMPK. Data are presented normalized to beta-actin and AMPKα2 expression. Data are shown as mean ±SEM, n = 3. *, p<0.05, GAL vs HG and LG.
Figure 4
Figure 4. Effect of an acute treatment with galactose medium on myotube aerobic capacity.
A. Basal oxygen consumption rate. B. State 4 respiration (leak dependent; non-phosphorylating). After basal oxygen consumption rate measurement, cells were treated with oligomycin (600 ng/ml) to determine state 4 respiration. C. Maximal oxygen consumption capacity. After basal and state 4 respiration, cells were treated with FCCP (1 µM) to determine maximal oxygen consumption. A–C. Myotubes were differentiated for 7 days in LG (5 mM glucose). On the 7th day of differentiation, myotubes were exposed to HG (25 mM), LG (5 mM glucose) or GAL (10 mM galactose) for 45 min before measuring basal oxygen consumption rate. Results are presented as means ± SEM, n = 4, in which each condition was assessed in 5 replicates.
Figure 5
Figure 5. Absence of an increase in basal oxygen consumption in post-diabetic myotubes differentiated in galactose media.
A. Basal oxygen consumption rate. *, p<0.05, GAL vs HG and LG. #, p<0.05, post-diabetic vs obese. B. State 4 respiration (leak dependent; non-phosphorylating). After basal oxygen consumption rate measurement, cells were treated with oligomycin (600 ng/ml) to determine state 4 respiration. C. Maximal oxygen consumption capacity. After basal and state 4 respiration, cells were treated with FCCP (1 µM) to determine maximal oxygen consumption. D. Non-mitochondrial oxygen consumption rate. After basal, state and maximal respiration, cells were treated with antimycin (4 µM) to determine non-mitochondrial oxygen consumption. ##, p<0.001, post-diabetic vs obese. A–D. Myotubes were differentiated for 7 days in HG (25 mM glucose), LG (5 mM glucose) or GAL (10 mM galactose). Results are presented as means ± SEM, n = 5, in which each condition was assessed in 5–6 replicates.
Figure 6
Figure 6. Absence of an increase in cytochrome C oxidase activity and AMPK phosphorylation in post-diabetic myotubes differentiated in galactose media.
A. Mitochondrial yield measured in post-diabetic myotubes differentiated for 7 days in HG (25 mM glucose), LG (5 mM glucose) or GAL (10 mM galactose). Mitochondrial yield was determined as mitochondrial protein content per total cellular protein content. Results are presented as means ± SEM, n = 4. *, p<0.05, LG vs HG, **, p<0.01 LG vs GAL. B. Cytochrome C oxidase activity measured in isolated mitochondria from post-diabetic myotubes differentiated for 7 days in HG (25 mM glucose), LG (5 mM glucose) or GAL (10 mM galactose). Results are presented as means ± SEM, n = 4. *, p<0.05, GAL vs HG and LG. C. Top panel: representative Western blot of Complex IV expression in post-diabetic myotubes differentiated for 7 days in HG (25 mM glucose), LG (5 mM glucose) or GAL (10 mM galactose). Beta-actin was used as a loading control. Bottom panel: quantification by densitometry of complex IV expression. Data are presented normalized to beta-actin expression. Data are shown as mean ±SEM, n = 4. D. Left panel: representative Western blot of P-AMPK expression in post-diabetic myotubes differentiated for 7 days in HG (25 mM glucose), LG (5 mM glucose) or GAL (10 mM galactose). Beta-actin was used as loading controls. Right panels: quantification by densitometry of P-AMPK. Data are presented normalized to beta-actin and AMPKα2 expression. Data are shown as mean ±SEM, n = 4.

References

    1. Bouzakri K, Roques M, Gual P, Espinosa S, Guebre-Egziabher F, et al. Reduced activation of phosphatidylinositol-3 kinase and increased serine 636 phosphorylation of insulin receptor substrate-1 in primary culture of skeletal muscle cells from patients with type 2 diabetes. Diabetes. 2003;52:1319–1325. - PubMed
    1. Jackson S, Bagstaff SM, Lynn S, Yeaman SJ, Turnbull DM, et al. Decreased insulin responsiveness of glucose uptake in cultured human skeletal muscle cells from insulin-resistant nondiabetic relatives of type 2 diabetic families. Diabetes. 2000;49:1169–1177. - PubMed
    1. Nikoulina SE, Ciaraldi TP, Carter L, Mudaliar S, Park KS, et al. Impaired muscle glycogen synthase in type 2 diabetes is associated with diminished phosphatidylinositol 3-kinase activation. J Clin Endocrinol Metab. 2001;86:4307–4314. - PubMed
    1. Gaster M, Petersen I, Hojlund K, Poulsen P, Beck-Nielsen H. The diabetic phenotype is conserved in myotubes established from diabetic subjects: evidence for primary defects in glucose transport and glycogen synthase activity. Diabetes. 2002;51:921–927. - PubMed
    1. Gaster M, Rustan AC, Aas V, Beck-Nielsen H. Reduced lipid oxidation in skeletal muscle from type 2 diabetic subjects may be of genetic origin: evidence from cultured myotubes. Diabetes. 2004;53:542–548. - PubMed

Publication types

MeSH terms