

Reduction in inflammatory gene expression in skeletal muscle from Roux-en-Y gastric bypass patients randomized to omentectomy
- PMID: 22194858
- PMCID: PMC3241684
- DOI: 10.1371/journal.pone.0028577
Reduction in inflammatory gene expression in skeletal muscle from Roux-en-Y gastric bypass patients randomized to omentectomy
Abstract
Objectives: To examine the effects of Roux-en-Y gastric bypass (RYGB) surgery with and without laparoscopic removal of omental fat (omentectomy) on the temporal gene expression profiles of skeletal muscle.
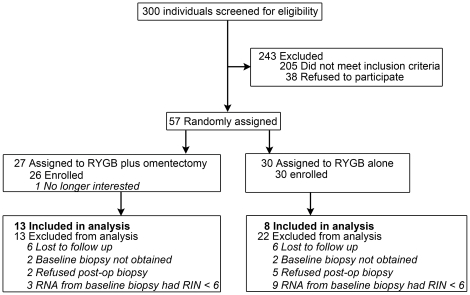
Design: Previously reported were the whole-body metabolic effects of a randomized, single-blinded study in patients receiving RYGB surgery stratified to receive or not receive omentectomy. In this follow up study we report on changes in skeletal muscle gene expression in a subset of 21 patients, for whom biopsies were collected preoperatively and at either 6 months or 12 months postoperatively.
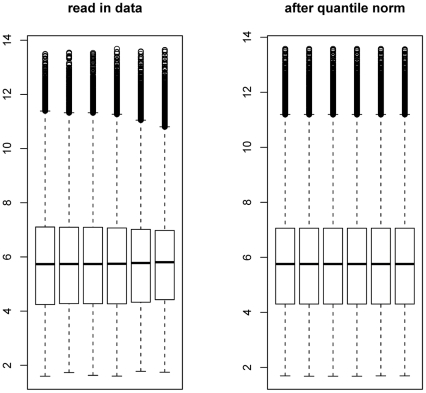
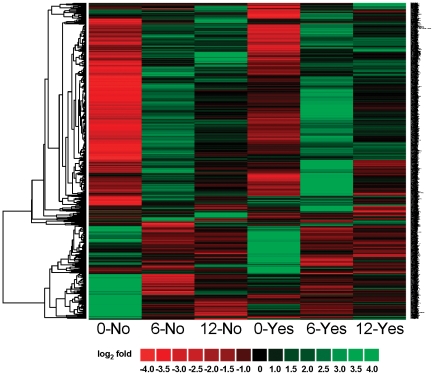
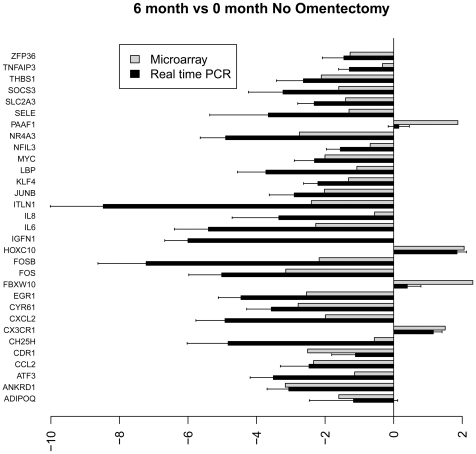
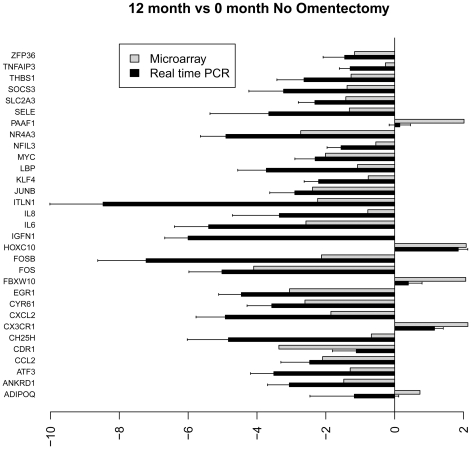
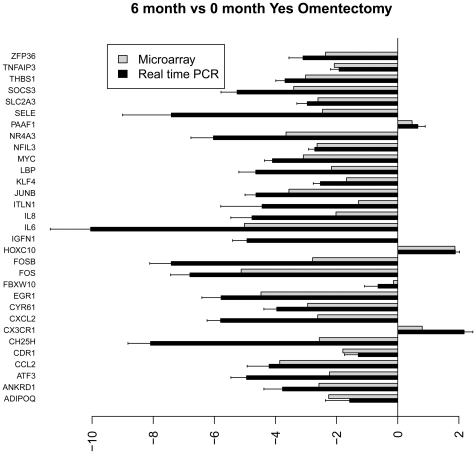
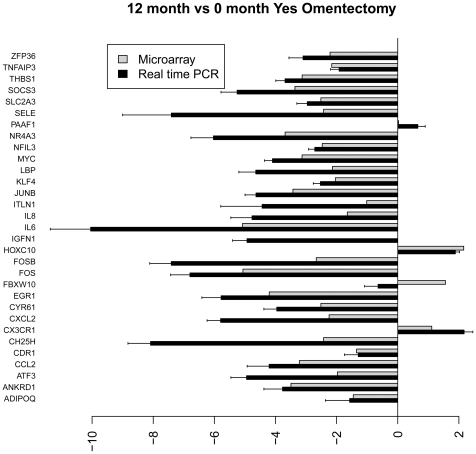
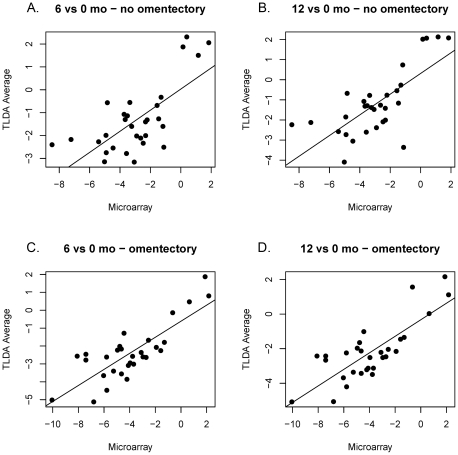
Methodology/principal findings: RNA isolated from skeletal muscle biopsies of 21 subjects (8 without omentectomy and 13 with omentectomy) taken before RYGB or at 6 and 12 months postoperatively were subjected to gene expression profiling via Exon 1.0 S/T Array and Taqman Low Density Array. Robust Multichip Analysis and gene enrichment data analysis revealed 84 genes with at least a 4-fold expression difference after surgery. At 6 and 12 months the RYGB with omentectomy group displayed a greater reduction in the expression of genes associated with skeletal muscle inflammation (ANKRD1, CDR1, CH25H, CXCL2, CX3CR1, IL8, LBP, NFIL3, SELE, SOCS3, TNFAIP3, and ZFP36) relative to the RYGB non-omentectomy group. Expressions of IL6 and CCL2 were decreased at all postoperative time points. There was differential expression of genes driving protein turnover (IGFN1, FBXW10) in both groups over time and increased expression of PAAF1 in the non-omentectomy group at 12 months. Evidence for the activation of skeletal muscle satellite cells was inferred from the up-regulation of HOXC10. The elevated post-operative expression of 22 small nucleolar RNAs and the decreased expression of the transcription factors JUNB, FOS, FOSB, ATF3 MYC, EGR1 as well as the orphan nuclear receptors NR4A1, NR4A2, NR4A3 suggest dramatic reorganizations at both the cellular and genetic levels.
Conclusions/significance: These data indicate that RYGB reduces skeletal muscle inflammation, and removal of omental fat further amplifies this response.
Trial registration: ClinicalTrials.gov NCT00212160.
Conflict of interest statement
Figures
References
-
- Dandona P, Aljada A, Bandyopadhyay A. Inflammation: the link between insulin resistance, obesity and diabetes. Trends Immunol. 2004;25:4–7. - PubMed
-
- Bastard JP, Maachi M, Van Nhieu JT, Jardel C, Bruckert E, et al. Adipose tissue IL-6 content correlates with resistance to insulin activation of glucose uptake both in vivo and in vitro. J Clin Endocrinol Metab. 2002;87:2084–2089. - PubMed
-
- Hotamisligil GS, Shargill NS, Spiegelman BM. Adipose expression of tumor necrosis factor-alpha: direct role in obesity-linked insulin resistance. Science. 1993;259:87–91. - PubMed
Publication types
MeSH terms
Substances
Associated data
Grants and funding
LinkOut - more resources
Full Text Sources
Medical
Research Materials
Miscellaneous
