. 2011;6(12):e29101.
doi: 10.1371/journal.pone.0029101. Epub 2011 Dec 14.

Quantification bias caused by plasmid DNA conformation in quantitative real-time PCR assay

Affiliations

Quantification bias caused by plasmid DNA conformation in quantitative real-time PCR assay

Chih-Hui Lin et al. PLoS One. 2011.

Abstract

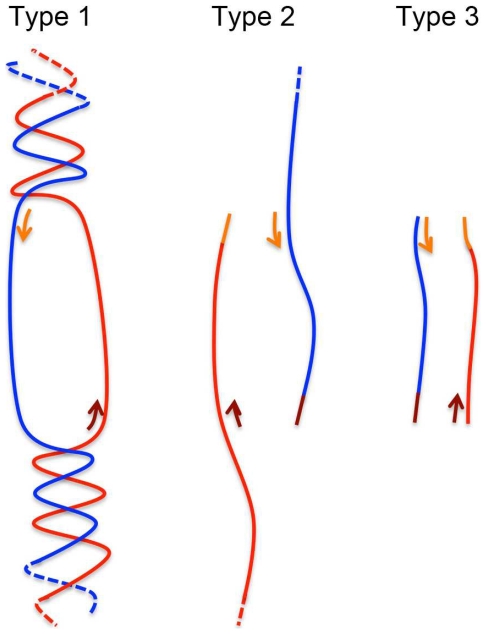
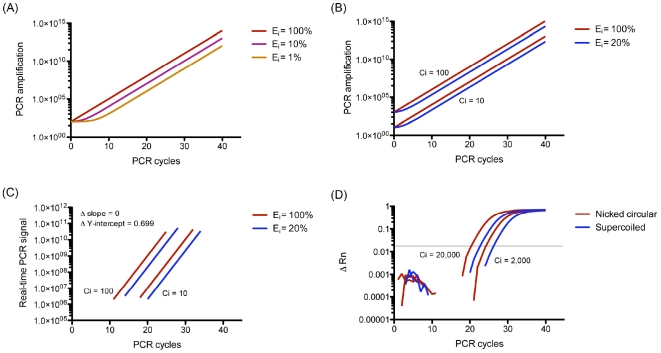
Quantitative real-time PCR (qPCR) is the gold standard for the quantification of specific nucleic acid sequences. However, a serious concern has been revealed in a recent report: supercoiled plasmid standards cause significant over-estimation in qPCR quantification. In this study, we investigated the effect of plasmid DNA conformation on the quantification of DNA and the efficiency of qPCR. Our results suggest that plasmid DNA conformation has significant impact on the accuracy of absolute quantification by qPCR. DNA standard curves shifted significantly among plasmid standards with different DNA conformations. Moreover, the choice of DNA measurement method and plasmid DNA conformation may also contribute to the measurement error of DNA standard curves. Due to the multiple effects of plasmid DNA conformation on the accuracy of qPCR, efforts should be made to assure the highest consistency of plasmid standards for qPCR. Thus, we suggest that the conformation, preparation, quantification, purification, handling, and storage of standard plasmid DNA should be described and defined in the Minimum Information for Publication of Quantitative Real-Time PCR Experiments (MIQE) to assure the reproducibility and accuracy of qPCR absolute quantification.


Conflict of interest statement

Competing Interests: The authors have declared that no competing interests exist.

Figures

Figure 1
Figure 1. Preparation of plasmid samples.
Lane M: 1 kb ladder DNA marker. Lane 1: S, supercoiled plasmid sample. Lane 2: L, linear plasmid sample (SspI treated). Lane 3: N, nicked-circular plasmid sample (Nt.BspQI treated). Lane 4: C, closed-circular plasmid sample (topoisomerase I treated). Lane 5: S-LB, supercoiled plasmid treated with SspI reaction buffer. Lane 6: S-NB, supercoiled plasmid treated with Nt.BspQI reaction buffer. Lane 7: S-CB, supercoiled plasmid treated with topoisomerase I reaction buffer.
Figure 2
Figure 2. Effect of plasmid DNA conformation on DNA measurement methods.
(A) Comparison of various methods on supercoiled plasmid DNA quantification. (B) Hoechst dye-based DNA quantification method. (C) Quant-iT dsDNA BR quantification assay. (D) OD260 DNA quantification method. S-LB: supercoiled plasmid treated with SspI reaction buffer. S-NB: supercoiled plasmid treated with Nt.BspQI reaction buffer. S-CB: supercoiled plasmid treated with topoisomerase I reaction buffer. a, b, c, d and e : groups with significant difference to each other (Duncan's multiple range test, P<0.05).
Figure 3
Figure 3. Effect of plasmid DNA conformation on qPCR calibration curves.
Each data point was the average of three triplicate tests (n = 9). Blue lines: Supercoiled plasmid calibration curves. Red lines: Linear plasmid calibration curves. Gold lines: Nicked-circular plasmid calibration curves. Magenta lines: close-circular calibration curves. Grey lines: Buffer control (S-LB, S-NB and S-CB, supercoiled) plasmid calibration curves.
Figure 4
Figure 4. Effect of plasmid DNA conformation on qPCR chemistries.
Relative amplification was calculated by the ΔCt value to the corresponding supercoiled plasmid group. Each data point was the average of three triplicate tests (n = 9) with 200 copies of plasmid DNA sample. * : P<0.05. *** : P<0.001.
Figure 5
Figure 5. Three hypothetical type of DNA amplification in qPCR.
Type I: The amplification from DNA template (plasmid). Type II : The amplification from PCR product of type I. Type III : The amplification of PCR product itself.
Figure 6
Figure 6. The proposed and virtual effect of initial PCR efficiency (Ei) on qPCR amplification curves (assuming Eii = Eiii).
Ei (initial PCR efficiency): the efficiency of type I amplification. Eii: the efficiency of type II amplification. Eiii: the efficiency of type III amplification. (A) Proposed amplification curves with 100% (theoretical), 10% and 1% Ei. (B) Proposed amplification curves of 100% and 20% Ei with 10 and 100 copies of DNA template (initial copy number, Ci). (C) Proposed amplification curves of 100% and 20% Ei with 10 and 100 Ci in PCR. Difference in Ei will consistently shift Ct value (by the change of Y-intercept). (D) PCR amplification curves of supercoiled and nicked-circular plasmid DNA with 2,000 and 20,000 Ci in this study.

References

    1. Ginzinger DG. Gene quantification using real-time quantitative PCR: an emerging technology hits the mainstream. Exp Hematol. 2002;30:503–512. - PubMed
    1. Holst-Jensen A, Ronning SB, Lovseth A, Berdal KG. PCR technology for screening and quantification of genetically modified organisms (GMOs). Anal Bioanal Chem. 2003;375:985–993. - PubMed
    1. Hou Y, Zhang H, Miranda L, Lin S. Serious overestimation in quantitative PCR by circular (supercoiled) plasmid standard: microalgal pcna as the model gene. PLoS One. 2010;5:e9545. doi: 10.1371/journal.pone.0009545. - DOI - PMC - PubMed
    1. Wong ML, Medrano JF. Real-time PCR for mRNA quantitation. Biotechniques. 2005;39:75–85. - PubMed
    1. Chen J, Kadlubar FF, Chen JZ. DNA supercoiling suppresses real-time PCR: a new approach to the quantification of mitochondrial DNA damage and repair. Nucleic Acids Res. 2007;35:1377–1388. - PMC - PubMed