. 2011;6(12):e29260.
doi: 10.1371/journal.pone.0029260. Epub 2011 Dec 14.

LPA is a chemorepellent for B16 melanoma cells: action through the cAMP-elevating LPA5 receptor

Affiliations

LPA is a chemorepellent for B16 melanoma cells: action through the cAMP-elevating LPA5 receptor

Maikel Jongsma et al. PLoS One. 2011.

Abstract

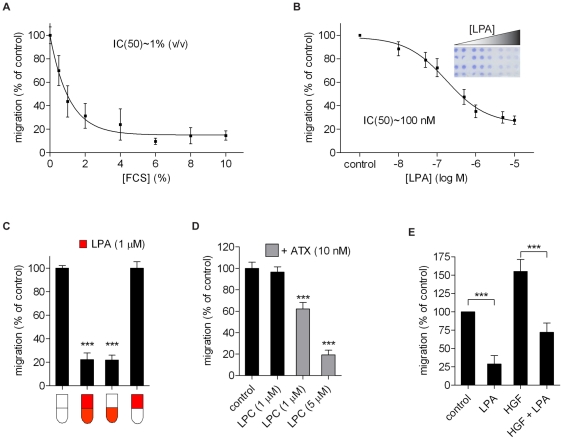
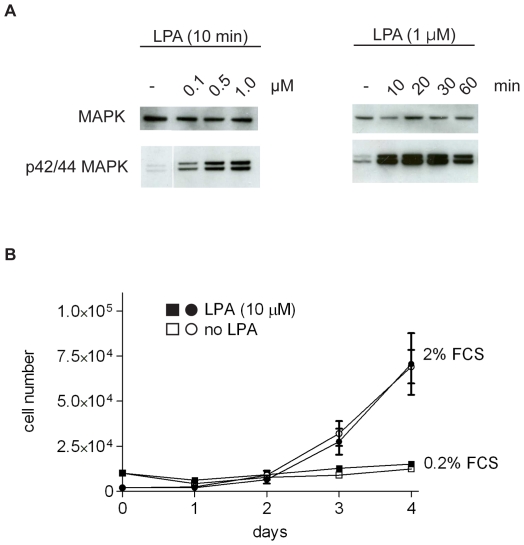
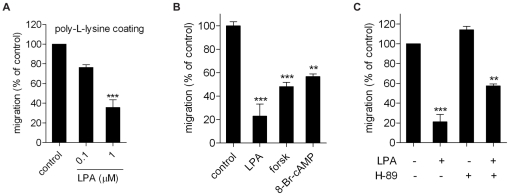
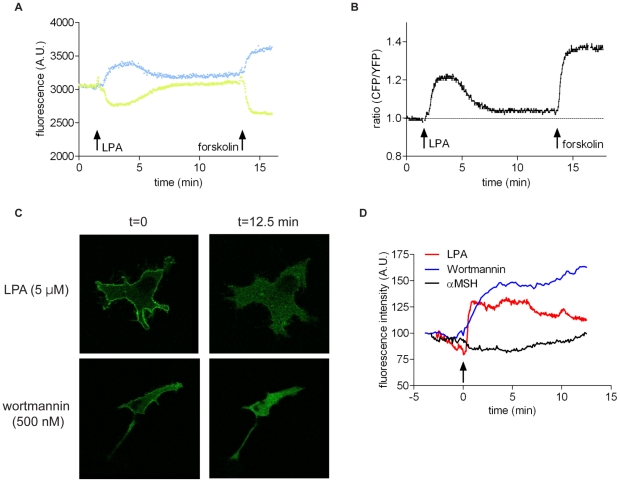
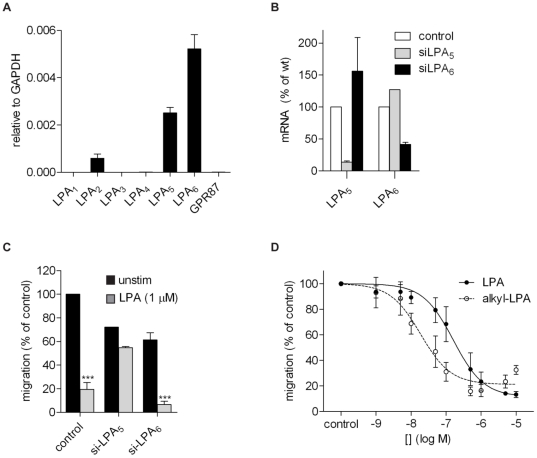
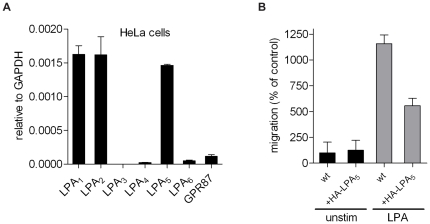
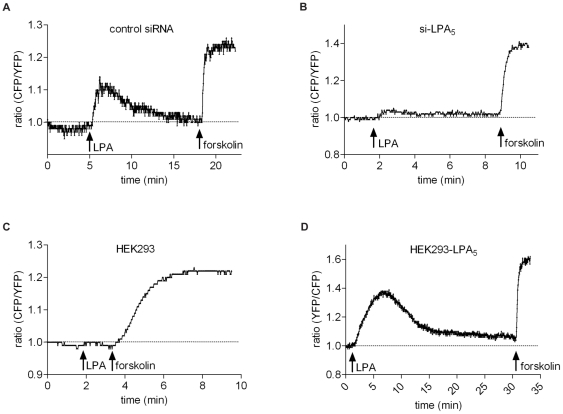
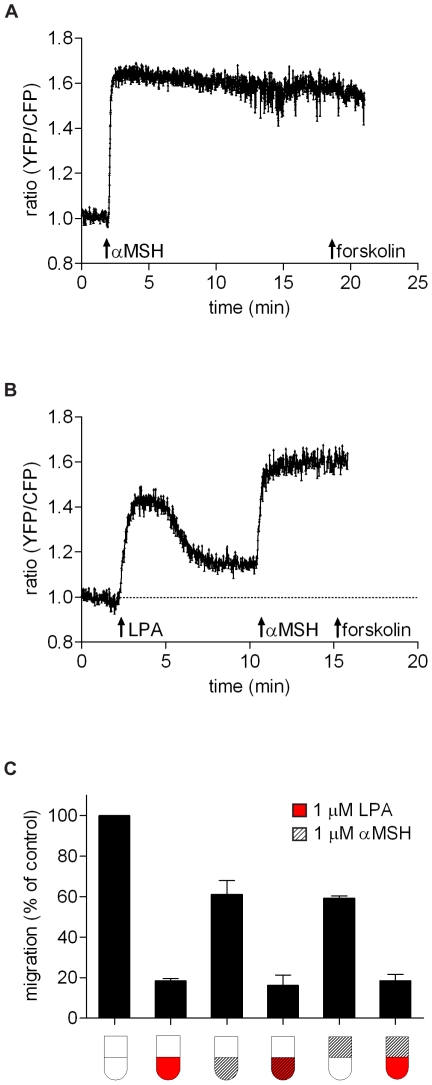
Lysophosphatidic acid (LPA), a lipid mediator enriched in serum, stimulates cell migration, proliferation and other functions in many cell types. LPA acts on six known G protein-coupled receptors, termed LPA(1-6), showing both overlapping and distinct signaling properties. Here we show that, unexpectedly, LPA and serum almost completely inhibit the transwell migration of B16 melanoma cells, with alkyl-LPA(18:1) being 10-fold more potent than acyl-LPA(18:1). The anti-migratory response to LPA is highly polarized and dependent on protein kinase A (PKA) but not Rho kinase activity; it is associated with a rapid increase in intracellular cAMP levels and PIP3 depletion from the plasma membrane. B16 cells express LPA(2), LPA(5) and LPA(6) receptors. We show that LPA-induced chemorepulsion is mediated specifically by the alkyl-LPA-preferring LPA(5) receptor (GPR92), which raises intracellular cAMP via a noncanonical pathway. Our results define LPA(5) as an anti-migratory receptor and they implicate the cAMP-PKA pathway, along with reduced PIP3 signaling, as an effector of chemorepulsion in B16 melanoma cells.


Conflict of interest statement

Competing Interests: The authors have declared that no competing interests exist.

Figures

Figure 1
Figure 1. LPA-induced inhibition of B16F10 cell migration.
B16F10 cells were allowed to migrate for 3 hrs through fibronectin-coated 8 µm porous membranes. A–B. Inhibition of cell migration by increasing concentrations of fetal calf serum (FCS) (A) or 1-oleoyl-LPA (B). The inset in B shows a representative transwell filter after staining. C. Cell migration was assayed using LPA (1 µM) in either the upper or lower chamber, or in both chambers, as schematically indicated by the red color. D. B16F10 cell migration in the presence of LPC (1 or 5 µM) with or without added recombinant autotaxin (ATX; 10 nM) in the lower chamber. E. Enhanced cell migration (chemotaxis) induced by HGF (50 ng/ml) and inhibitory effect of LPA (1 µM). Values are the means ± SEM of at least three independent experiments and were normalized to the migration of non-stimulated cells (*** P<0.0001).
Figure 2
Figure 2. Effect of LPA on ERK1/2 activity and cell proliferation.
A. LPA-induced activation of ERK1/2 in B16F10 cells. Western blot analysis of total ERK1/2 and phosphorylated ERK1/2 (MAPK), using anti-ERK1/2 and anti-pERK1/2 antibodies. Cells were stimulated with the indicated LPA concentration for the indicated periods of time. The blots are representative of three independent experiments. B. Cells were plated at day zero in medium containing 10% FCS. After 16 hrs, the cells were exposed to medium containing 0.2% or 2% FCS, with or without added LPA (10 µM). LPA was refreshed every 24 hrs and cells were counted in triplicate. Values are the means ± SEM (N = 5).
Figure 3
Figure 3. Effect of poly-L-lysine and cAMP reagents on cell migration.
A. Inhibitory effect of LPA on B16F10 cells plated on poly-L-lysine-coated membranes. B. Effects of forskolin (25 µM) and 8-Br-cAMP (100 µM) on transwelll migration of B16F10 cells. C. Effect of PKA inhibitor H-89 (30 µM) on cell migration in the presence or absence of LPA (1 µM). Values are the means ± SEM (N = 3; each experiment performed in quadruplo) (**P<0.001; *** P<0.0001).
Figure 4
Figure 4. LPA-induced changes in cAMP and PIP3 in B16 cells.
A–B. Time course of LPA-induced changes in cAMP, monitored by using the FRET-based sensor CFP-Epac-YFP. A. Time course of the separate CFP and YFP signals (blue and green, respectively). B. An increase in the ratio CFP/YFP reflects an increase in [cAMP] (loss of FRET due to Epac unfolding [27]). LPA, 1 µM; forskolin (10 µM) was used to calibrate the response. C. Confocal images of LPA- and wortmannin-induced loss of PIP3 from the plasma membrane, as inferred from the translocation of PH(GRP1)-GFP to the cytosol. See also Video S1. D. Agonist-induced increase in cytosolic PH(GRP1)-GFP fluorescence, reflecting loss of PIP3 from the plasma membrane. Dynamic changes in fluorescence intensity (relative to non-stimulated control) were quantified using ImageJ software. LPA, 1 µM; wortmannin, 500 nM; α-MSH, 1 µM.
Figure 5
Figure 5. Evidence for LPA5 mediating inhibition of cell migration.
A. LPA receptor expression in B16F10 cells as determined by qPCR. GPR87 is a putative LPA receptor that awaits validation . B. Knockdown of LPA5 and LPA6 expression using specific siRNA pools (see Materials and Methods). Values are relative to GAPDH mRNA levels (A) or as percentage (B). Values are the means ± SEM (N = 5). C. Migration of B16F10 cells transfected with siRNA against LPA5 or LPA6, or a non-targeting siRNA (control), in the presence or absence of LPA. Relative values are the means (± SEM) of two independent experiments each performed in quadruplo (*** P<0.0001). D. Inhibition of cell migration by increasing concentrations of 1-oleoyl-LPA and 1-alkyl-LPA(18∶1). IC50 values: alkyl-LPA(18∶1) ∼10 nM; LPA(18∶1) ∼100 nM.
Figure 6
Figure 6. Reduced chemotactic response to LPA in LPA5-transfected HeLa cells.
A. LPA receptor expression in HeLa cells as determined by qPCR. GPR87 is a putative LPA receptor that awaits validation . B. Wild-type or HA-LPA5-transfected Hela cells were allowed to migrate for 24 hrs in the presence or absence of LPA (1 µM) as indicated. Note reduced chemotaxis in the LPA5 transfectants. Values are normalized to migration of unstimulated cells (means ± SEM; N = 4).
Figure 7
Figure 7. Rise in cAMP mediated by LPA5.
Cells transfected with CFP-Epac-YFP were stimulated with LPA (1 µM) and forskolin (10 µM) as indicated. The traces depict a cAMP-induced loss of FRET (unfolding of Epac) as an increase in CFP/YFP ratio . A. B16 cells transfected with non-targeting siRNA. B. B16 cells transfected with siRNA against LPA5. D. Wild-type HEK293T cells. E. HEK293T cells transfected with LPA5. All traces are representative of at least three independent experiments.
Figure 8
Figure 8. Effects of α-MSH on cAMP and cell migration.
A–B. B16F10 cells, expressing CFP-Epac-YFP, were stimulated with α-MSH (1 µM), LPA (1 µM) and forskoIin (10 µM) as indicated. C. Inhibition of transwell migration by α-MSH, when present in either the upper or the lower chamber as illustrated.

Similar articles

Cited by

References

    1. Choi JW, Herr DR, Noguchi K, Yung YC, Lee CW, et al. LPA receptors: subtypes and biological actions. Annu Rev Pharmacol Toxicol. 2010;50:157–186. - PubMed
    1. Chun J, Hla T, Lynch KR, Spiegel S, Moolenaar WH. International Union of Basic and Clinical Pharmacology. LXXVIII. Lysophospholipid Receptor Nomenclature. Pharmacol Rev. 2010;62:579–587. - PMC - PubMed
    1. Eichholtz T, Jalink K, Fahrenfort I, Moolenaar WH. The bioactive phospholipid lysophosphatidic acid is released from activated platelets. Biochem J. 1993;291(Pt 3):677–680. - PMC - PubMed
    1. van Meeteren LA, Moolenaar WH. Regulation and biological activities of the autotaxin-LPA axis. Prog Lipid Res. 2007;46:145–160. - PubMed
    1. Aoki J, Inoue A, Okudaira S. Two pathways for lysophosphatidic acid production. Biochim Biophys Acta. 2008;1781:513–518. - PubMed

Publication types

MeSH terms

LinkOut - more resources