. 2011 Dec 23;35(6):1023-34.
doi: 10.1016/j.immuni.2011.12.002.

Innate and adaptive interferons suppress IL-1α and IL-1β production by distinct pulmonary myeloid subsets during Mycobacterium tuberculosis infection

Affiliations

Innate and adaptive interferons suppress IL-1α and IL-1β production by distinct pulmonary myeloid subsets during Mycobacterium tuberculosis infection

Katrin D Mayer-Barber et al. Immunity. .

Abstract

Interleukin-1 (IL-1) receptor signaling is necessary for control of Mycobacterium tuberculosis (Mtb) infection, yet the role of its two ligands, IL-1α and IL-1β, and their regulation in vivo are poorly understood. Here, we showed that both IL-1α and IL-1β are critically required for host resistance and identified two multifunctional inflammatory monocyte-macrophage and DC populations that coexpressed both IL-1 species at the single-cell level in lungs of Mtb-infected mice. Moreover, we demonstrated that interferons (IFNs) played important roles in regulating IL-1 production by these cells in vivo. Type I interferons inhibited IL-1 production by both subsets whereas CD4(+) T cell-derived IFN-γ selectively suppressed monocyte-macrophages. These data provide a cellular basis for both the anti-inflammatory effects of IFNs and probacterial functions of type I IFNs during Mtb infection and reveal differential regulation of IL-1 production by distinct cell populations as an additional layer of complexity in the activity of IL-1 in vivo.


Figures

Figure 1
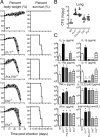
Figure 1. Mtb infected Il1a-/- mice display acute mortality and elevated bacterial loads comparable to Il1b-/- animals
(A) Body weight and survival of WT, Il1r1-/-, Il1a,Il1b-/-, Il1b-/-and Il1a -/- mice after aerosol exposure to Mtb (H37Rv). (B) Bacterial loads measured 25 days p.i. in lungs of the above mouse strains. (C) Indicated cytokines were measured by ELISA in BAL fluid of WT (white bars), Il1r1-/- (black bars), Il1a,Il1b-/- (dark grey bars), Il1b-/- (light grey bars) and Il1a-/- (grey and white striped bars) mice and the means ± SD depicted. Dotted lines indicate the limits of detection of the respective assays. Data are representative of a minimum of 2 independent experiments each involving 5-10 mice per group. * denotes significant (p≤0.05) differences compared to WT controls.
Figure 2
Figure 2. IL-1α and IL-1β are co-expressed by two pulmonary CD11bpos populations, distinguished by Ly6C, CD11c, CD13 and CD282 expression during Mtb infection
(A) Pulmonary single cell suspensions from 4 wks infected mice were FACS sorted based on Ly6G and CD11b expression into three populations and subsequently stimulated for 18hrs with H37Rv (Mtb) or left unstimulated (unst.). Data shown are means ± SD of IL-1α and IL-1β in culture supernatants. (B) Lung cells from naïve or 4 wk infected mice were stimulated for 5hrs with (5hr Mtb) or without (unst.) H37Rv and then stained intracellularly for IL-1α and IL-1β. Numbers indicate mean percentage (± SD) of IL-1 producing cells in depicted gate. (C) Data depict the mean number of IL-1βproducing (± SD) cells per lung at various time points after infection. (D) CD68 staining of IL-1 producing cells and use of Ly6C and CD11c for further subsetting (numbers indicate percentage of respective population in depicted gate ± SD). (E) Proportion of IL-1α,β co-producing cells 4 wks p.i. in each subset after re-stimulation for 5hrs with (Mtb, dark circles) or without (unst., white circles) H37Rv. Each connecting line depicts an individual animal. (F) CD282 and CD13 expression in correlation with CD11c and IL-1α. Numbers indicate percentage of IL-1 producing cells in depicted gate after re-stimulation for 5hrs with Mtb. Data in A-F are representative of a minimum of 2 experiments with 3-10 mice each.
Figure 3
Figure 3. IL-1α,β co-expressing cells in the lungs of Mtb infected mice are highly poly-functional but distinct from IL-12,23 p40 producing cells
(A-D) Quantitative and qualitative analysis of cytokine production in indicated subsets 28 days after Mtb infection of WT mice. (A) Frequencies of iNOS, TNFα, IL-10 and IL-12,23p40 expressing cells within iM (top) and iDC (bottom) subsets after re-stimulation for 5hrs with (Mtb, dark circles) or without (unst., white circles) H37Rv determined by ICS. Each connecting line depicts an individual animal. (B) Co-staining of IL-1α with indicated cytokines and iNOS. (C) Percentage of cytokine producing cells within IL-1α expressing cells of the iM (top) or iDC (bottom) subset. (D) Simultaneous analysis of the functional profile of pulmonary iM (top) and iDC (bottom) subsets after Mtb infection on the basis of IL-1a, IL-1β, iNOS, and TNFα expression. All combinations of the possible cytokine expression patterns are marked on the x-axis, whereas the percentages (mean ± SD) of the distinct cytokine-producing subsets within iM or iDC cells are shown on the y-axis. The data is summarized in pie charts and each slice corresponds to the proportion of iM or iDC cells expressing a given combination of cytokines indicated by the colored boxes at the bottom of the x-axis. Data in A-D are representative of a minimum of 3 independent experiments with 3-6 animals each.
Figure 4
Figure 4. Type I and II IFNs negatively regulate IL-1α and IL-1β secretion by murine and human myeloid cell subsets infected with Mtb
(A) Murine cytokines measured by ELISA in supernatants of BMMΦ and BMDC from WT mice after exposure to live Mtb (MOI:1) for 48hrs in the presence or absence of recombinant murine IL-27, IFNγ or pICLC. (B) IL-1β protein in supernatants of BMMΦ and BMDC from WT, Ifnar1-/- or Ifngr1-/- mice incubated with IFNγ or pICLC as indicated after exposure to live Mtb (MOI:1). (C) Human IL-1α .~1β measured by ELISA in culture supernatants of human monocyte-derived macrophages (MΦ) or monocyte-derived DCs from 21 healthy donors after 24hrs exposure to live Mtb (MOI:5) in the presence or absence of pICLC or the recombinant human cytokines IFNβ and IFNγ. Horizontal lines indicate the median values. *** denotes significant (p < 0.0001) differences compared to Mtb exposure alone. (D) IL-1Ra protein in culture supernatants of human MΦ or DCs (top panels) and murine BMMΦ and BMDC (bottom panels) incubated as noted in A and B. (E) Cytokines in supernatants of BMMΦ derived from WT or Ifnar1-/- mice after exposure to live Mtb (MOI:1) for 24hrs. (F) IL-10 protein in supernatants of WT BMMΦ incubated with increasing amounts of pICLC for 40hrs in the presence or absence of Mtb infection. (G) IL-1β protein in supernatants of WT BMMΦ after exposure to live Mtb (MOI:1) for 24hrs incubated with recombinant murine IFNβ in the presence or absence of neutralizing IL-10 mAb.Murine data presented are the means ± SD and representative of 2-5 independent experiments. * denotes significant (p≤0.05) differences compared to Mtb exposure alone or as indicated with connecting lines.
Figure 5
Figure 5. Endogenous type I IFNs suppress IL-1α,β expression by both iM and iDC pulmonary subsets during Mtb infection
(A) Pulmonary bacterial loads measured 4 wks p.i. in WT or Ifnar1-/- mice. (B) ICS for IL-1α,β by pulmonary myeloid cells in WT or Ifnar1-/- mice 4 wks p.i. Data are representative of 2 independent experiments each involving 3-5 mice per group. * denotes significant (p≤0.05) difference compared to WT control. Numbers indicate mean percentage (± SD) of IL-1 producing cells in depicted gate. (C) WT CD45.1,1 mice were lethally irradiated and reconstituted with equal ratios of WT (CD45.1,2) and Ifnar1-/- (CD45.2,2) BM cells and infected with Mtb. (D) Analysis of donor BM derived CD11bpos myeloid cells 4 wks p.i. in isolated lung cells marked by CD45.1 and CD45.2 expression (percentage ± SD) and frequency of IL-1α,β expression by WT (white circles) or Ifnar1-/- (KO, dark circles) total CD11bpos mononuclear myeloid cells after re-stimulation for 5hrs with (Mtb) or without (unst.) Mtb. Each connecting line depicts an individual animal. (E) Frequency of IL-1α,β expression by iM and iDC subsets in mixed Ifnar1-/- BM chimeric mice. (F-G) Frequencies of iNOS, TNFα and IL-10 expressing cells within pulmonary WT (white circles) or Ifnar1-/- (KO, dark circles) iM cells (F) and within iDC (G) cells. Data in A-F are representative of three independent experiments with 3-5 mice each. * denotes significant (p≤0.05) differences compared to WT controls (ns= not significant).
Figure 6
Figure 6. IFNγ specifically inhibits IL-1α,β expression in the iM but not iDC subset
WT CD45.1,1 mice were lethally irradiated and reconstituted with equal parts WT (CD45.1,2) and Ifngr1-/- (CD45.2,2) BM cells and infected with Mtb. (A-B) Distribution of donor BM derived pulmonary CD11bpos myeloid cells 4 wks p.i. marked by CD45.1 and CD45.2 expression (percentage ± SD) and analysis of IL-1α,β expression by iM (A) and iDC (B) subsets gated on WT (WT, white circles) or Ifngr1-/- (KO, dark circles) after stimulation for 5hrs with (Mtb,) or without (unst.) Mtb. Each connecting line depicts an individual animal. (C-D) Frequencies of iNOS, TNFα and IL-10 expressing cells within pulmonary WT (white circles) or Ifngr1-/- (KO, dark circles) iM (C) and iDC (D) subsets. Data in A-E are representative of three independent experiments with 3-5 mice each. * denotes significant (p≤0.05) differences compared to WT controls (ns= not significant).
Figure 7
Figure 7. CD4+ T cell derived IFNγ is sufficient to suppress IL-1 production by iM cells in vivo
(A) Bacterial loads were measured in lungs of WT, □□□□-/- and □□□□-/- mice reconstituted with WT or Ifng-/- CD4+ T cells. * denotes significant (p≤0.05) differences compared to WT controls (ns= not significant). (B) Pulmonary single cell suspensions from animals in the indicated experimental groups were incubated with Mtb and IL-1β was measured by ELISA in the culture supernatant after 8 hrs. Data shown are derived from a pool of 3-5 mice per group. (C-D) ICS for IL-1α and IL-1β expression by iM (C) and iDC (D) subsets in lungs of □□□□-/- mice reconstituted with WT (left plot, white squares) or Ifng-/- (right plot, dark squares) CD4+ T cells and frequencies of IL-1α,β expression after stimulation for 5hrs with (Mtb) or without (unst.) Mtb. Data in A-E are representative of two independent experiments with 3-5 mice each. * denotes significant (p≤0.05) differences compared to WT controls (ns= not significant).

References

    1. Antonelli LR, Gigliotti Rothfuchs A, Goncalves R, Roffe E, Cheever AW, Bafica A, Salazar AM, Feng CG, Sher A. Intranasal Poly-IC treatment exacerbates tuberculosis in mice through the pulmonary recruitment of a pathogen-permissive monocyte/macrophage population. J Clin Invest. 2010;120:1674–1682. - PMC - PubMed
    1. Berry MP, Graham CM, McNab FW, Xu Z, Bloch SA, Oni T, Wilkinson KA, Banchereau R, Skinner J, Wilkinson RJ, et al. An interferon-inducible neutrophil-driven blood transcriptional signature in human tuberculosis. Nature. 2010;466:973–977. - PMC - PubMed
    1. Biswas SK, Mantovani A. Macrophage plasticity and interaction with lymphocyte subsets: cancer as a paradigm. Nat Immunol. 2010;11:889–896. - PubMed
    1. Chang EY, Guo B, Doyle SE, Cheng G. Cutting edge: involvement of the type I IFN production and signaling pathway in lipopolysaccharide-induced IL-10 production. J Immunol. 2007;178:6705–6709. - PubMed
    1. Cheong C, Matos I, Choi JH, Dandamudi DB, Shrestha E, Longhi MP, Jeffrey KL, Anthony RM, Kluger C, Nchinda G, et al. Microbial stimulation fully differentiates monocytes to DC-SIGN/CD209(+) dendritic cells for immune T cell areas. Cell. 2010;143:416–429. - PMC - PubMed

Publication types

MeSH terms