

Extensions to regret-based decision curve analysis: an application to hospice referral for terminal patients
- PMID: 22196308
- PMCID: PMC3305393
- DOI: 10.1186/1472-6947-11-77
Extensions to regret-based decision curve analysis: an application to hospice referral for terminal patients
Abstract
Background: Despite the well documented advantages of hospice care, most terminally ill patients do not reap the maximum benefit from hospice services, with the majority of them receiving hospice care either prematurely or delayed. Decision systems to improve the hospice referral process are sorely needed.
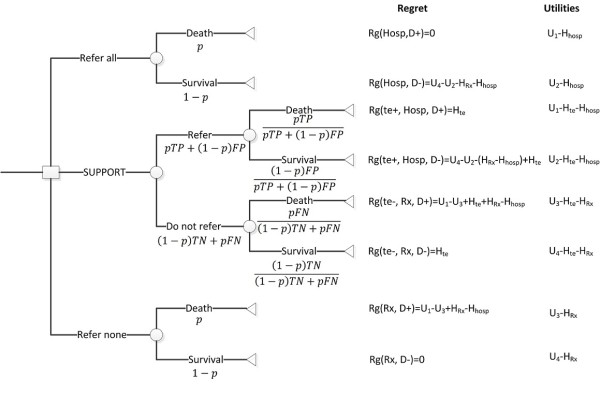
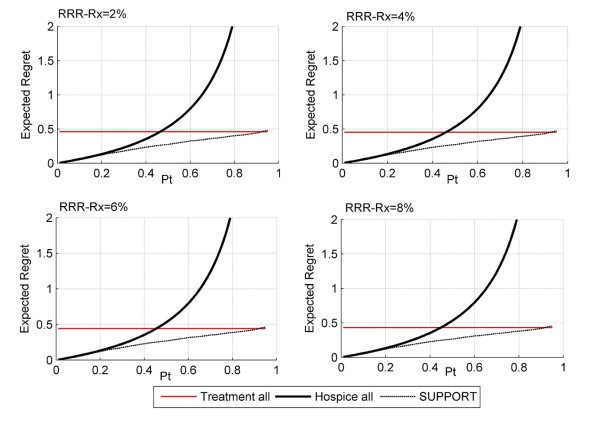
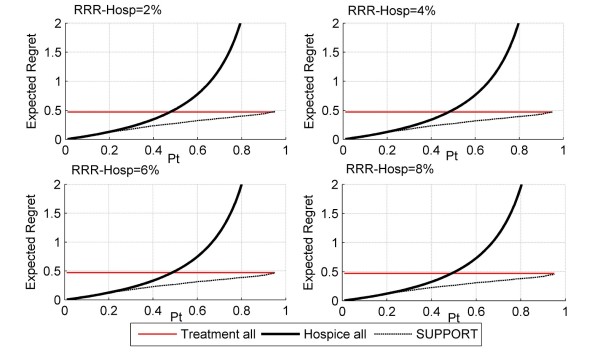
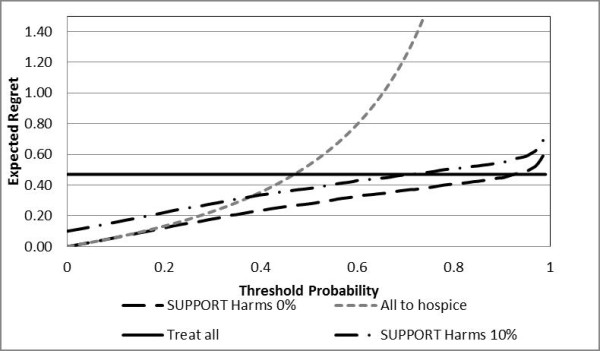
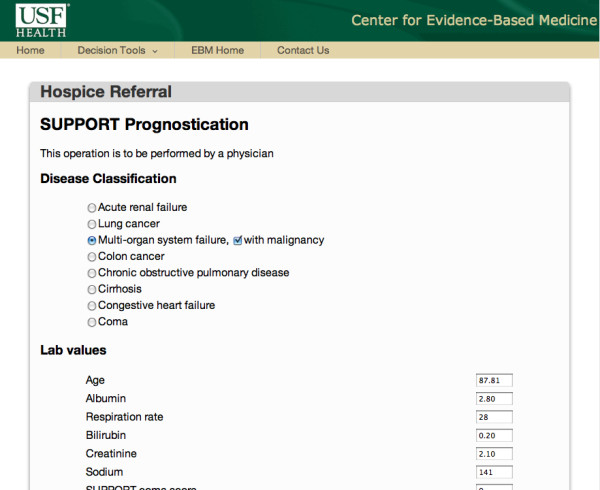
Methods: We present a novel theoretical framework that is based on well-established methodologies of prognostication and decision analysis to assist with the hospice referral process for terminally ill patients. We linked the SUPPORT statistical model, widely regarded as one of the most accurate models for prognostication of terminally ill patients, with the recently developed regret based decision curve analysis (regret DCA). We extend the regret DCA methodology to consider harms associated with the prognostication test as well as harms and effects of the management strategies. In order to enable patients and physicians in making these complex decisions in real-time, we developed an easily accessible web-based decision support system available at the point of care.
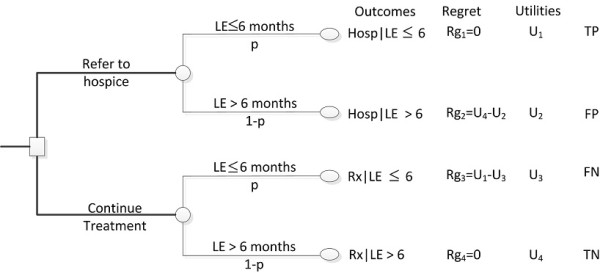
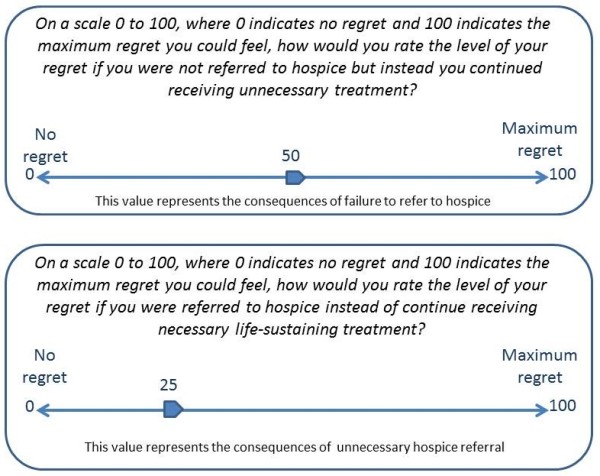
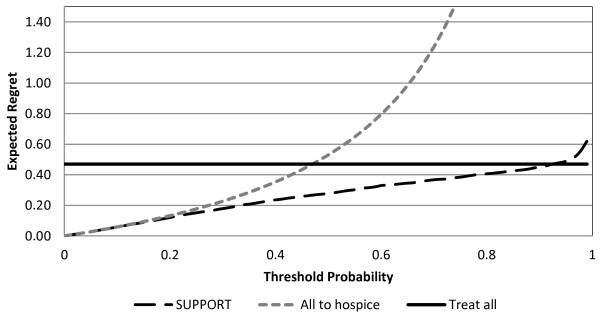
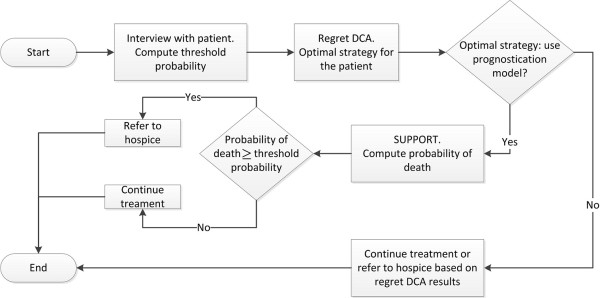
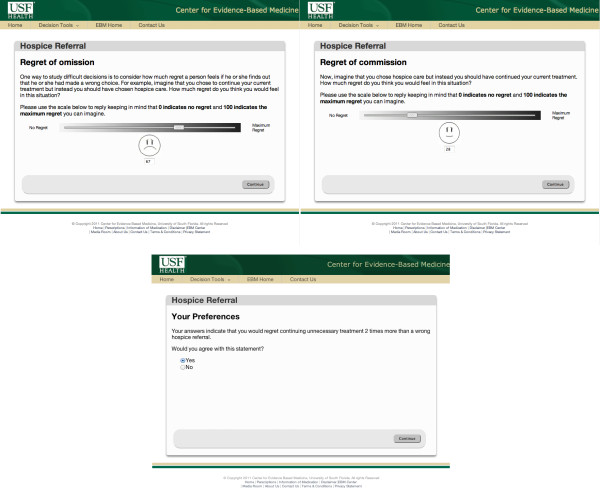
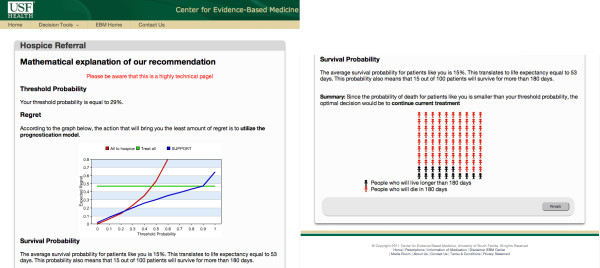
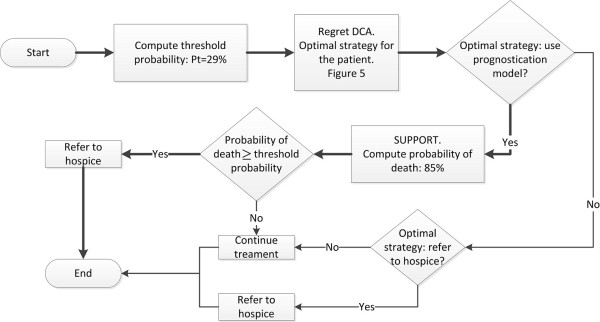
Results: The web-based decision support system facilitates the hospice referral process in three steps. First, the patient or surrogate is interviewed to elicit his/her personal preferences regarding the continuation of life-sustaining treatment vs. palliative care. Then, regret DCA is employed to identify the best strategy for the particular patient in terms of threshold probability at which he/she is indifferent between continuation of treatment and of hospice referral. Finally, if necessary, the probabilities of survival and death for the particular patient are computed based on the SUPPORT prognostication model and contrasted with the patient's threshold probability. The web-based design of the CDSS enables patients, physicians, and family members to participate in the decision process from anywhere internet access is available.
Conclusions: We present a theoretical framework to facilitate the hospice referral process. Further rigorous clinical evaluation including testing in a prospective randomized controlled trial is required and planned.
Figures
Similar articles
-
Eliciting regret improves decision making at the end of life.Eur J Cancer. 2016 Nov;68:27-37. doi: 10.1016/j.ejca.2016.08.027. Epub 2016 Oct 3. Eur J Cancer. 2016. PMID: 27710829
-
Acceptable regret model in the end-of-life setting: Patients require high level of certainty before forgoing management recommendations.Eur J Cancer. 2017 Apr;75:159-166. doi: 10.1016/j.ejca.2016.12.025. Epub 2017 Feb 22. Eur J Cancer. 2017. PMID: 28235727
-
Monte Carlo decision curve analysis using aggregate data.Eur J Clin Invest. 2017 Feb;47(2):176-183. doi: 10.1111/eci.12723. Eur J Clin Invest. 2017. PMID: 28042671
-
Predicting patient survival before and after hospice enrollment.Hosp J. 1998;13(1-2):71-87. doi: 10.1080/0742-969x.1998.11882889. Hosp J. 1998. PMID: 9644394 Review.
-
Barriers to physicians' decisions to discuss hospice: insights gained from the United States hospice model.J Eval Clin Pract. 2003 Aug;9(3):363-72. doi: 10.1046/j.1365-2753.2003.00406.x. J Eval Clin Pract. 2003. PMID: 12895158 Review.
Cited by
-
Dual Processing Model for Medical Decision-Making: An Extension to Diagnostic Testing.PLoS One. 2015 Aug 5;10(8):e0134800. doi: 10.1371/journal.pone.0134800. eCollection 2015. PLoS One. 2015. PMID: 26244571 Free PMC article.
-
Regret in Surgical Decision Making: A Systematic Review of Patient and Physician Perspectives.World J Surg. 2017 Jun;41(6):1454-1465. doi: 10.1007/s00268-017-3895-9. World J Surg. 2017. PMID: 28243695
-
Decision threshold models in medical decision making: a scoping literature review.BMC Med Inform Decis Mak. 2024 Sep 27;24(1):273. doi: 10.1186/s12911-024-02681-2. BMC Med Inform Decis Mak. 2024. PMID: 39334341 Free PMC article.
-
Expected utility versus expected regret theory versions of decision curve analysis do generate different results when treatment effects are taken into account.J Eval Clin Pract. 2018 Feb;24(1):65-71. doi: 10.1111/jep.12676. Epub 2016 Dec 15. J Eval Clin Pract. 2018. PMID: 27981695 Free PMC article.
-
Thinking Styles and Regret in Physicians.PLoS One. 2015 Aug 4;10(8):e0134038. doi: 10.1371/journal.pone.0134038. eCollection 2015. PLoS One. 2015. PMID: 26241650 Free PMC article.
References
-
- Christakis NA. Death foretold. Prophecy and prognosis in medical care. The University of Chicago Press; 2001.
Publication types
MeSH terms
LinkOut - more resources
Full Text Sources
Medical
