Comparative Study
. 2011 Dec 22;72(6):991-1000.
doi: 10.1016/j.neuron.2011.11.014.

The pore of the voltage-gated proton channel

Affiliations
Comparative Study

The pore of the voltage-gated proton channel

Thomas K Berger et al. Neuron. .

Abstract

In classical tetrameric voltage-gated ion channels four voltage-sensing domains (VSDs), one from each subunit, control one ion permeation pathway formed by four pore domains. The human Hv1 proton channel has a different architecture, containing a VSD, but lacking a pore domain. Since its location is not known, we searched for the Hv permeation pathway. We find that mutation of the S4 segment's third arginine R211 (R3) compromises proton selectivity, enabling conduction of a metal cation and even of the large organic cation guanidinium, reminiscent of Shaker's omega pore. In the open state, R3 appears to interact with an aspartate (D112) that is situated in the middle of S1 and is unique to Hv channels. The double mutation of both residues further compromises cation selectivity. We propose that membrane depolarization reversibly positions R3 next to D112 in the transmembrane VSD to form the ion selectivity filter in the channel's open conformation.


Figures

Figure 1
Figure 1. Cartoon and sequence alignment of the human voltage gated proton channel (hHv1)
A, Membrane topology model of hHv1, with specific residues emphasized: D112 in S1, R205 (R1), R208 (R2), R211 (R3) and N214 (N4) in S4. B, sequence alignment of voltage-gated proton channels (human hHv1, mouse mVSOP, Ciona intestinales ciVSOP, and Strongylocentrotus purpuratus spVSOP) and voltage gated K+ channels (Shaker and Kv1.2).
Figure 2
Figure 2. The R3S mutant conducts guanidinium ions
A, Top, inside-out patches of R3S have large outward currents upon depolarization and inward tail currents upon repolarization in 100 mM symmetric [Gu+]i = [Gu+]o, whereas WT and N4S have no detectable currents. Bottom, tail currents of R3S. B, conductance-voltage relationship (n = 8), fitted Boltzmann (V1/2 = 50.17 ± 3.31 mV and kT/ze0 = 15.25 ± 0.68 mV). Error bars denote s.e.m. C, Tail currents at various holding potentials for symmetric [Gu+]i = [Gu+]o = 100 mM (purple traces) and asymmetric [Gu+]i = 10 mM, [NMDG+]i = 90 mM, [Gu+]o = 100mM conditions (green traces). Triangles mark current measurement time point for current-voltage relation. D, Left, example of a current-voltage relation of tail currents. Arrows mark expected reversal potentials for pure Gu+ selectivity (0 mV for symmetric and 58.76 mV for asymmetric condition, dashed lines mark actual zero crossings. Right, interpolated reversal potentials for symmetric and asymmetric conditions are significantly different (Erev sym = 4.20 ± 1.10 mV, Erev asym = 49.50 ± 0.83 mV, n = 3, paired t-test, p < 0.01; error bars denote s.e.m). Bar graphs display the mean. Data points are shown as circles connected by lines for each individual patch. Similarity between predicted and observed reversal potentials indicates that Gu+ is the major charge carrying ion through R3S at pH 8.
Figure 3
Figure 3. The R3S mutant retains hallmark properties of WT hHv1
A, Proton conduction by R3S mutant is efficiently blocked by external application of 100 μM Zn2+. A voltage step from −80 mV to 100 mV was applied to outside-out patches with (green traces and bars) or without (purple traces and bars) external 100 μM Zn2+. Bar graphs display the mean outward current (measured at the end of the depolarizing voltage step, as indicated by an arrow). Data points are shown as circles connected by lines for each individual patch. B, Gu+ conduction by R3S is blocked efficiently by external application of 100 μM Zn2+. Same color code as in panel A. Error bars denote s.e.m. C, Mutant R3S preserves the ability to sense ΔpH gradient over the membrane. The slope is −48.9 ± 1.23 mV/pH unit.
Figure 4
Figure 4. Protons take same pathway as guanidinium ions through R3S and R3C
A, Internal Gu+ reduces outward proton current in symmetrical pH = 6 for both WT (top) and R3S (bottom), suggesting that Gu+ enters and blocks the proton permeation pathway. A voltage step from −80 mV to 100 mV was applied to inside-out patches with (green traces and bars) or without (purple traces and bars) internal 10 mM Gu+. B, Internal MTSET (1 mM) strongly reduces both proton conduction through R3C channels at pH 6 (top) and Gu+ conduction at pH 8 (bottom). A voltage step from −80 mV to 100 mV applied before (purple traces and bars) and after (green traces and bars) bath application of 1 mM MTSET. In A and B, bar graphs display the mean outward current (measured at the end of the depolarizing voltage step, as indicated by an arrow).Data points are shown as circles connected by lines for each individual patch. Error bars denote s.e.m.
Figure 5
Figure 5. D112 interacts with R3
A, Proton currents in response to depolarizing step voltages in WT (black), R3S (red), D112S (green, n = 3), double mutant D112S-R3S (dark blue), and D112E (blue) at pHi = pHo = 6. Holding potential was −80 mV. B, G-V relationships of WT and mutant channels. D112S is normalized to WT Gmax. Single Boltzmann fits, WT: V1/2 = 59.28 ± 2.34 mV, kT/ze0 = 15.27± 0.61 mV, n = 3; R3S: V1/2 = 146.47 ± 4.1 mV, kT/ze0 = 24.92 ± 0.8 mV, n = 6; D112S-R3S: V1/2 = 82.65± 3.26 mV, kT/ze0 = 17.86 ± 1.2 mV, n = 5; D112E: V1/2 = 44.03 ± 6 mV, kT/ze0 = 14.86 ± 0.77 mV, n = 4. Error bars denote s.e.m. C, Model of hHv1 shows S4 stabilized in activated state when the positively charged R3 approaches the negatively charged D112 (WT).
Figure 6
Figure 6. Like WT, the charge-swapped double mutant D112R-R3D does not conduct Gu+
Inside-out patches were initial recorded in symmetric 100 mM Gu+ pH 8 solution (black traces), and subsequently internally perfused with 0 mM Gu+ pH 6 solution. Mutant R3D displays an outward current in symmetric Gu solution (marked by an arrow), whereas WT and D112R-R3D do not. Relative maximal outward current reduction by 100 mM Gu pH 8 vs 0 mM Gu pH6 was 99.1 ± 0.7 % for WT, 52.2 ± 13.6 % for D112R-R3D, and 92.3 ± 4.7 % for D112R-R3D. Bar graphs display the mean outward current (measured at the end of the depolarizing voltage step). Data points are shown as circles connected by lines for each individual patch. Errors bars denote s.e.m.
Figure 7
Figure 7. R3 and D112 influence metal cation conduction
A-D, Normalized representative traces (upper) and average amplitudes normalized to Li+ (lower) of outward currents, in presence and absence of metal cations or Gu+ during depolarization to +60 mV in inside-out patches of WT (A), R3S (B), D112S-R3S (C) and D112E (D). Bar graphs display the mean outward current (measured at the end of the depolarizing voltage step). Data points are shown as circles connected by lines for each individual patch. Recordings began in [Na+]i = [Na+]o = 100 mM at pH 8 (black traces) and bath (internal) solution was then changed to 100 mM K+, Li+, Cs+, and Gu+ at pH 8 (blue, purple, green, and orange). Fraction of current carried by protons (see Figure S5) shown in the insets (zoom in) as dashed lines. Note that R3S and D112S-R3S differ in profile from WT and from each other, indicating that both R3 and D112 contribute to selectivity. Error bars denote s.e.m.
Figure 8
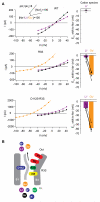
Figure 8. R3 and D112 line the pore and determine cation selectivity
A, Reversal potentials Erev measured by a serious of holding potentials after an activating depolarizing step voltage (+100 mV for 0.2 s, same protocol as depicted in Figure 2C) for inside-out patches of WT, R3S, and D112S-R3S. Recordings began in [Na+]i = [Na+]o = 100 mM at pH 8 and bath (internal) solution was then changed to 100 mM Li+ and/or Gu+ at pH 8. Bar graphs depict the shift of mean Erev after cation change. Data points are shown as circles connected by lines for each individual patch. B, Model of the selectivity filter of hHv1 consisting of R3 and D112 as inferred from our data. Error bars denote s.e.m.

Similar articles

Cited by

References

    1. Baker OS, Larsson HP, Mannuzzu LM, Isacoff EY. Three transmembrane conformations and sequence-dependent displacement of the s4 domain in shaker k+ channel gating. Neuron. 1998;20(6):1283–1294. - PubMed
    1. DeCaen PG, Yarov-Yarovoy V, Zhao Y, Scheuer T, Catterall WA. Disulfide locking a sodium channel voltage sensor reveals ion pair formation during activation. Proc Natl Acad Sci U S A. 2008;105(39):15142–15147. - PMC - PubMed
    1. DeCoursey TE. Voltage-gated proton channels and other proton transfer pathways. Physiol Rev. 2003;83(2):475–579. - PubMed
    1. DeCoursey TE. Voltage-gated proton channels. Cell Mol Life Sci. 2008;65(16):2554–2573. - PMC - PubMed
    1. DeCoursey TE, Morgan D, Cherny VV. The voltage dependence of nadph oxidase reveals why phagocytes need proton channels. Nature. 2003;422(6931):531–534. - PubMed

Publication types

LinkOut - more resources