. 2011 Dec 23;147(7):1484-97.
doi: 10.1016/j.cell.2011.11.051.

Single-molecule mRNA decay measurements reveal promoter- regulated mRNA stability in yeast

Affiliations

Single-molecule mRNA decay measurements reveal promoter- regulated mRNA stability in yeast

Tatjana Trcek et al. Cell. .

Abstract

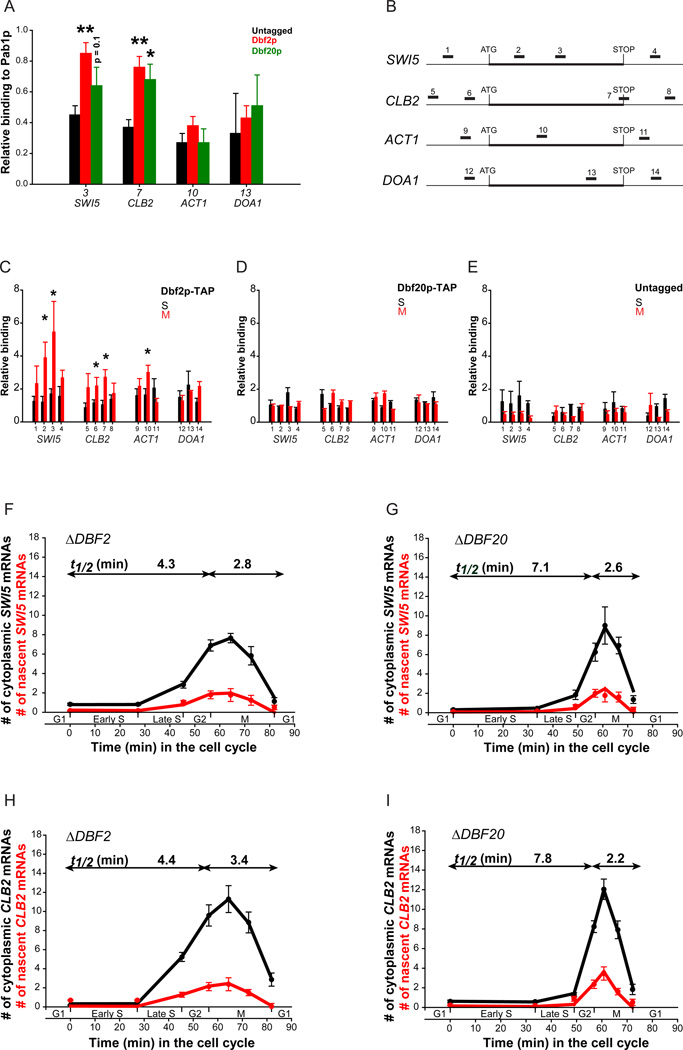
Messenger RNA decay measurements are typically performed on a population of cells. However, this approach cannot reveal sufficient complexity to provide information on mechanisms that may regulate mRNA degradation, possibly on short timescales. To address this deficiency, we measured cell cycle-regulated decay in single yeast cells using single-molecule FISH. We found that two genes responsible for mitotic progression, SWI5 and CLB2, exhibit a mitosis-dependent mRNA stability switch. Their transcripts are stable until mitosis, when a precipitous decay eliminates the mRNA complement, preventing carryover into the next cycle. Remarkably, the specificity and timing of decay is entirely regulated by their promoter, independent of specific cis mRNA sequences. The mitotic exit network protein Dbf2p binds to SWI5 and CLB2 mRNAs cotranscriptionally and regulates their decay. This work reveals the promoter-dependent control of mRNA stability, a regulatory mechanism that could be employed by a variety of mRNAs and organisms.


Figures

Figure 1
Figure 1
Stability of SWI5 and CLB2 changes with the cell cycle phase. (A–C) Thiolutin was added to exponentially growing cells and relative mRNA levels were measured using qRT-PCR. Green line: decay curves fitted to an exponential decay with a single component; SWI5 t1/2: 6.9+/− 1.0 min (R2=0.87); CLB2 t1/2: 3.7+/−0.5 min (R2=0.96); ACT1 t1/2: 41.3+/− 14.5 min (R2=0.57). Red line: decay curves fitted to an exponential decay with two components; SWI5 t1/21: 3.0+/−0.9 min and t1/22 > 90 min (R2=0.98); CLB2 t1/21 = t1/22: 3.7 min (R2=0.96); ACT1 t1/21 = t1/22: 41.0 min (R2=0.57). (D,E) Cells were synchronized in S phase with hydroxyurea (HU) and mRNA decay measured after thiolutin was added. For measurements in mitosis, cells were removed from the cell cycle block, grown for one hour, then thiolutin was added and mRNA decay measured (Gill et al., 2004). In S phase, SWI5 and CLB2 were decay resistant. ACT1 t1/2: 29.0+/−8.2 min (R2=0.74) and in M phase, SWI5 and CLB2 decayed with t1/2 ~ 3 min. ACT1 t1/2: 31.5+/−8.3 min (R2=0.67). In all panels, an average of two experiments with SD is shown. (F,G) Cells synchronized with HU in S phase (t=0 min) and mitosis (t=60 min). Images of DIC, nucleus (DAPI) and a spindle pole body marker (Spc42-CFP) are shown. Scale bar = 1 µm. See also Figure S1.
Figure 2
Figure 2
Measuring mRNA decay rates using single-cell, single-molecule FISH. (A) In red: A mix of cy3.5 labeled probes was used to count single cytoplasmic transcripts. In green: a 5′-most cy3 labeled probe was used to count the number of nascent chains at the transcription site (arrow head). (B) Morphological markers used to bin cells into cell cycle phases: G1, Early S, Late S, G2, Prometaphase/Metaphase (P/M), Anaphase (ANA) and Telophase/Cytokinesis (T/C). An average cell cycle phase length between two experiments +/− SD is shown. Minimally 600 cells per experiment were counted and the length of each phase in minutes calculated. Scale bar: 1 µm. See also Figure S2.
Figure 3
Figure 3
Decay of SWI5 and CLB2 mRNAs is coordinated with transcription. (A,B) Percent of cells with a SWI5 or CLB2 transcription site per cell cycle phase. (C,D) Determining the mitotic decay constant. Black lines and circles: number of cytoplasmic SWI5 and CLB2 mRNAs/cell (N) +/− SEM determined by FISH. Blue curve: Cytoplasmic SWI5 and CLB2 mRNA profiles fitted to a single exponential decay model where, during mitosis SWI5 and CLB2 decayed with a t1/2 of 2.1+/−0.8 min (R2=0.94) and t1/2 of 1.8+/−0.5 min (R2=0.97), respectively. Green line: SWI5 and CLB2 decay curve from published literature with t1/2=8 min and t1/2=4.5 min, respectively (Wang et al., 2002). Gray boxes demarcate a new cell cycle. (E,F) Quantifying the pre-mitotic decay constant using the mathematical model. Black circles: as in A,B. Red circles: number of SWI5 and CLB2 nascent mRNAs/cell (m) +/− SEM determined by FISH. Black line: mathematical fit to N. Red line: mathematical fit to m. For SWI5 T=66 s, a pre-mitotic t1/2>90 min and a mitotic t1/2=2.1 min (χ2 = 31.5). For CLB2 T =63 s, a pre-mitotic phase t1/2=66.1 min and a mitotic t1/2=1.8 min (χ2=50.0). In all graphs, x axis delineates duration of each cell cycle phase (min). M includes P/M; ANA and T/C. See also Figure S3.
Figure 4
Figure 4
SWI5 mRNA decay is determined by its promoter. (A) Design of an integration cassette. Colors denote gene origins: SWI5, yellow; ACT1, blue; DOA1 pale blue; selection marker, green. (B) WT ACT1 expression over the cell cycle. Note the increase in transcription and transcripts after gene duplication. Summed fluorescence intensity +/− SD is shown with images of ACT1 expressing cells (see Suppl. Exp. Procedures). (C) WT DOA1. Black circles: N +/− SEM and red circles: m +/− SEM quantified by FISH, black line: mathematical fit to N, red line: mathematical fit to m. T of 68 s, t1/2=11.0 min (χ2=46.7). (D–F) Swapping of SWI5 regulatory sequence elements with ACT1 and DOA1 show the promoter is the determinant of decay. Black circles: N +/− SEM and red circles: m +/− SEM quantified by FISH, black line: mathematical fit to N, red line: mathematical fit to m. (D) Chimeric SWI5 with ACT1 5′ and 3′ UTR. T of 64 s, a pre-mitotic t1/2 > 90 min (χ2=25.7) and a mitotic t1/2 =2.4+/−1.3 min (R2=0.92). (E) SWI5 with ACT1 promoter: T of 72 s, and a t1/2=19.7 min (χ2=162.1). (F) DOA1 with DOA1 5′ and 3′ UTRs expressed from a SWI5 promoter. T of 68 s, a pre-mitotic t1/2 > 90 min (χ2=109.9) and a mitotic t1/2=4.9+/−0.7 min (R2=0.99). For B–F see Experimental Procedures and Table S3. In all graphs the x axis delineates duration of each cell cycle phase (min). M includes P/M; ANA and T/C. Images of cells through the cell cycle for each strain are shown. Scale bar: 1 µm. See also Figure S4.
Figure 5
Figure 5
CLB2 mRNA decay is determined by its promoter. (A,B) An integration cassette used to create the strain is shown. Colors denote gene origins: ACT1, blue; DOA1 pale blue; CLB2 violet; selection marker, green. In the graphs, black circles: number of cytoplasmic CLB2 or DOA1 mRNAs/cell (N) +/− SEM determined by FISH, red circles: number of CLB2 or DOA1 nascent mRNAs/cell (m) +/− SEM determined by FISH, black line: mathematical fit to N, red line: mathematical fit to m. (A) CLB2 mRNA expressed from the ACT1 promoter: T = 66 s and a t1/2 of 4.9 min (χ2 = 32.4). (B) DOA1 mRNA expressed from the CLB2 promoter: T = 77 s, a pre-telophase/cytokinesis t1/2 of 14.7 min and a telophase/cytokinesis t1/2 of 0.9 min (χ2=32.5). In all graphs the x axis delineates duration of each cell cycle phase (min). M includes 3 cell cycle phases: P/M; ANA and T/C. Images of cells through the cell cycle are shown. Scale bar: 1 µm.
Figure 6
Figure 6
Dbf2p, but not Dbf20p, associates with SWI5 and CLB2 mRNA during transcription and regulates their mRNA stability. (A) RNA immunoprecipitation of SWI5 and CLB2 mRNAs with Dbf2p-TAP and Dbf20p-TAP from mitotic cells. Binding relative to Pab1p-TAP is shown. Significant enrichment relative to untagged cells is indicated (t-test; * p<0.05 and ** p<0.01). (B) The positions of PCR amplicons used in A–E for each gene are depicted (Table S5). (C–E) Dbf2p-TAP, Dbf20p-TAP and an untagged control were immunopurified from S phase (black bars) or mitotic cells (red bars). Association of these proteins to various regions of SWI5, CLB2, ACT1, and DOA1 genes was analyzed by qPCR. Data are represented as relative to binding to TEL V, a telomeric region in Chromosome V. In each panel, an average of three experiments with the SEM is shown. Significant enrichment relative to the S phase cells is indicated (t-test; * p<0.05). (F–I) Dbf2p and Dbf20p deletions affect SWI5 and CLB2 mRNA stability. Black circles: N +/− SEM, red circles: m +/− SEM, black line: mathematical fit to N, red line: mathematical fit to m. (F) SWI5 in ΔDBF2: T of 66 s, pre-mitotic t1/2 = 4.3 min and a mitotic t1/2 =2.8 min (χ2 = 6.3) (G) SWI5 in ΔDBF20: T of 66 s, pre-mitotic t1/2 =7.1 min and a mitotic t1/2 =2.6 min (χ2 = 18.9) (H) CLB2 in ΔDBF2: T of 63 s, pre-mitotic t1/2 = 4.4 min and mitotic t1/2 =3.4 min (χ2 =115.7) (I) CLB2 in ΔDBF20: T of 63 s, pre-mitotic t1/2 =7.8 min and a mitotic t1/2 =2.2 min (χ2 = 40.3). In all graphs the x axis delineates duration of each cell cycle phase (min). M includes P/M; ANA and T/C. See also Figure S5 and S6.
Figure 7
Figure 7
Model proposing the life path of SWI5 and CLB2 mRNAs. Dbf2p is recruited to the SWI5 and CLB2 promoters and is co-transcriptionally deposited onto SWI5 and CLB2 mRNAs. Once exported into the cytoplasm, SWI5 and CLB2 mRNA stability is additionally maintained by Dbf20p. During mitosis, Dbf2p is dephosphorylated (Toyn and Johnston, 1994), which could be a cell cycle progression signal to initiate decay possibly through regulation of the CCR4-NOT complex and deadenylation of the transcripts.

Comment in

References

    1. Ardehali MB, Lis JT. Tracking rates of transcription and splicing in vivo. Nat Struct Mol Biol. 2009;16:1123–1124. - PubMed
    1. Balagopal V, Parker R. Polysomes, P bodies and stress granules: states and fates of eukaryotic mRNAs. Curr Opin Cell Biol. 2009;21:403–408. - PMC - PubMed
    1. Bean JM, Siggia ED, Cross FR. Coherence and timing of cell cycle start examined at single-cell resolution. Mol Cell. 2006;21:3–14. - PubMed
    1. Brewer BJ, Chlebowicz-Sledziewska E, Fangman WL. Cell cycle phases in the unequal mother/daughter cell cycles of Saccharomyces cerevisiae. Mol Cell Biol. 1984;4:2529–2531. - PMC - PubMed
    1. Cai T, Aulds J, Gill T, Cerio M, Schmitt ME. The Saccharomyces cerevisiae RNase mitochondrial RNA processing is critical for cell cycle progression at the end of mitosis. Genetics. 2002;161:1029–1042. - PMC - PubMed

Publication types

MeSH terms