. 2011 Dec 23;147(7):1628-39.
doi: 10.1016/j.cell.2011.09.057.

Combinatorial patterning of chromatin regulators uncovered by genome-wide location analysis in human cells

Affiliations

Combinatorial patterning of chromatin regulators uncovered by genome-wide location analysis in human cells

Oren Ram et al. Cell. .

Abstract

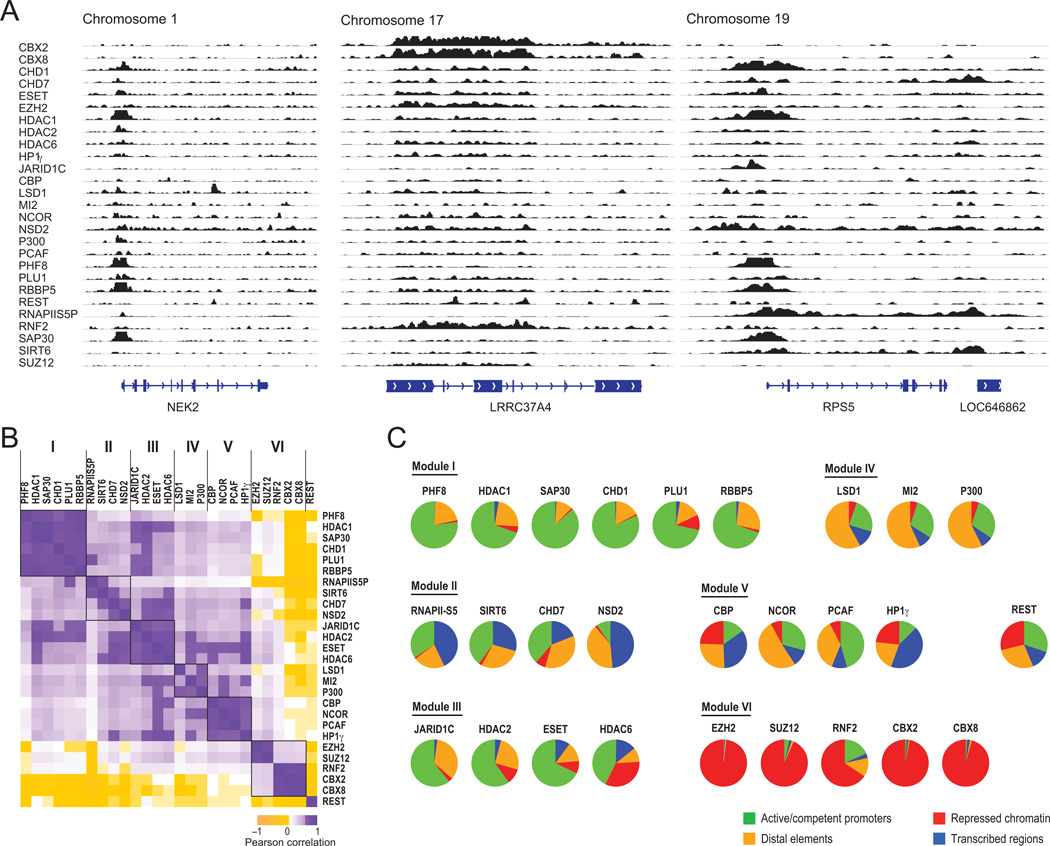
Hundreds of chromatin regulators (CRs) control chromatin structure and function by catalyzing and binding histone modifications, yet the rules governing these key processes remain obscure. Here, we present a systematic approach to infer CR function. We developed ChIP-string, a meso-scale assay that combines chromatin immunoprecipitation with a signature readout of 487 representative loci. We applied ChIP-string to screen 145 antibodies, thereby identifying effective reagents, which we used to map the genome-wide binding of 29 CRs in two cell types. We found that specific combinations of CRs colocalize in characteristic patterns at distinct chromatin environments, at genes of coherent functions, and at distal regulatory elements. When comparing between cell types, CRs redistribute to different loci but maintain their modular and combinatorial associations. Our work provides a multiplex method that substantially enhances the ability to monitor CR binding, presents a large resource of CR maps, and reveals common principles for combinatorial CR function.


Figures

Figure 1
Figure 1. A systematic approach for associating CRs to genomic loci and chromatin states
(A) CR associations with chromatin modification states. Right: The chromatin regulator EZH2 (pink gear) is associated (arrow) with a locus marked by the histone modification H3K27me3 (small red ball). Left: For many other chromatin regulators (non-colored gears, CR) their target loci and associated modifications (different colored balls) remain unknown. (B) Our process consists of four steps (left to right): 1. ChIP assays were performed with 145 different antibodies targeting 92 distinct CRs and 15 modifications. 2. ChIP samples were screened for enrichment across 487 signature loci by ChIP-string to identify promising CR antibodies. 3. These antibodies were applied in ChIP-seq to generate genome-wide maps for 29 CRs. 4. We identified target loci and associated histone modifications for each CR. We found that the CRs partition into six modules with correlated binding patterns, and also exhibit instances of combinatorial binding.
Figure 2
Figure 2. Screening CR-antibodies by ChIP-string
(A) Comparison of H3K4me3 ChIP-string to ChIP-seq data. Scatter plots compare ChIP-seq read density (X-axis) against ChIP-string counts (Y-axis). The adjacent panels reflect ChIP-string experiments performed with 5 ng of DNA (left), 0.5 ng of DNA (middle), or after whole genome amplication of 0.5 ng of DNA (right). Spearman correlations (R) are indicated at lower right. (B) ChIP-string assays that scored positively associate with distinct histone modification ‘states’. Columns represent ChIP-string data for 21 CR antibodies (bold) and 12 histone modification antibodies (non-bold). Relative enrichments are indicated for the 200 most informative loci (rows); white indicates no enrichment, black indicates high enrichment. The probes were clustered, and then sorted by the ‘chromatin states’ of the corresponding locus (initiation – green; elongation or enhancer – purple; Polycomb-repressed – red; heterochromatin – light blue). The experiments (columns) were ordered by hierarchical clustering and then fine-tuned by visual inspection (Experimental Procedures). Supporting data for ChIP-string and antibody specificity are presented in Figure S1.
Figure 3
Figure 3. CR binding maps reveal modular organization and coherent associations with chromatin states
(A) Binding of CRs at representative genomic loci in K562 cells. ChIP-seq profiles for 27 CRs are shown across three loci (Chromosome 1: 211,833,852-211,852,044; Chromosome 17: 43,580,509-43,600,984; Chromosome 19: 58,895,062-58,910,985). Examples of tracks derived from human ES cells (H1) are shown in Figure S2. (B) CRs partition into modules with correlated binding profiles. Correlation matrix reflects pair-wise correlations of binding peaks between CR datasets. Purple: positive correlation between CRs; yellow: negative correlation. White: no correlation. Correspondence is evident among CRs within each of the six CR Modules (demarcated by black squares). (C) For each CR, a pie chart indicates the proportion of binding sites that reside in regions with a given chromatin state annotation (green – active/competent promoter; gold – distal regulatory element/candidate enhancer; red – repressed chromatin; blue – transcribed region). CRs within a common module have similar distributions of binding.
Figure 4
Figure 4. Fine-scale CR binding profiles distinguish coherent gene sets
(A) Combinatorial binding patterns of CRs at individual promoters are associated with distinct expression and function. Fine-scale binding profiles are shown for CRs (vertical sections) across 1,081 target promoters (rows) after hierarchical clustering and re-ordering of major promoter clusters based on expression (original ordering shown in Figure S3). The profiles depict enrichment Z-scores (red – high, white – low) for 300 bp windows within 3 kb of TSSs. Promoter clusters derived based on common CR binding profiles (indicated by thick white horizontal lines) share transcriptional status, and the corresponding genes often share coherent functions (labels on right, curated from enriched functional gene sets, listed in Table S4B). Left bar shows RNA expression levels (log2(FPKM)) derived from RNA-seq data: orange – high; blue – low; white – median. CR labels colored according to the dendrogram shown above. (B–D) Composite profiles for CRs with similar binding patterns at shared promoters. Profiles reflect average binding of the indicated CRs (Y axis) over co-bound promoters, centered on TSSs (X axis). (B) Peaks that surround TSSs, but dip at the TSS itself for CHD1 (purple) and SIRT6 (blue). (C) Sharp peaks over TSSs for HDAC2 (purple), PHF8 (green) and SAP30 (blue). (D) bimodal peaks of Polycomb CRs – diffuse peaks over TSSs for PRC2 members EZH2 (purple) and SUZ12 (blue) along with TSS-excluded peaks for PRC1 members CBX2 (green) and CBX8 (brown). (E) Composite profiles for CRs with distinct binding patterns at shared promoters. PLU1 (purple) has a sharp peak over TSSs, while CHD1 (blue) has a broader peak that extends downstream. Note that the promoters in this composite differ from panel B. (F–G) Composite profiles show distinct patterns for the same CR at promoter sets with different activity levels. (F) HDAC2 at PRC2-repressed (blue) and transcriptionally–competent promoters (purple). (G) HDAC1 at transcriptionally-competent (cluster 5, purple) and active (cluster 1, blue) promoters.
Figure 5
Figure 5. Comparisons of CR binding and modular associations in K562 and ES cells
(A) CRs distribute to distinct loci in ES and K562 cells. For each CR (left) or histone modification (right), bar graph indicates proportions of binding intervals that are ES cell-specific (‘H1 only’, light blue), K562-specific (‘K562 only’, gray) or overlapping between cell types (‘H1 and K562’, navy). The bars are vertically centered according to the overlap regions. (B) CR-CR associations and CR-histone modification associations are largely preserved between K562 and ES cells. Scatter plot presents the correlations in localization profiles between every pair of CRs (black dots) and every CR-histone modification pair (red dots) in either K562 cells (X axis) or ES cells (Y axis). Linear regression lines and correlation coefficients are indicated for each type of combination. (C) CRs associate with similar chromatin states in ES and K562 cells with some distinctions. Pie charts indicate the proportion of CR binding sites that correspond to a given chromatin state annotation; green – active/competent promoter, gold – distal regulatory element/candidate enhancer, red – repressed chromatin (including bivalent state), blue – transcribed region. CRs are grouped according to the modules in Figure 3. (D) Combinatorial binding profiles are shown for CRs in ES cells. Fine-scale binding profiles are shown for each CR across 1189 target promoters (rows) in ES cells, after hierarchical clustering and re-ordering of major promoter clusters as in Figure 4A (original ordering shown in Figure S4). Functional gene set annotations (right) curated from enriched sets (Table S5B). CR labels colored as in Figure 4A, with ES cell-specific CRs in black.
Figure 6
Figure 6. Principles of CR organization
Model of the association of CRs (gears) with histone modifications (little colored balls) across (A) actively transcribed genes, (B) transcriptionally competent TSSs, and (C) Polycomb-repressed regions. CRs colored as in Figures 4A and 5D.

References

    1. Barski A, Cuddapah S, Cui K, Roh TY, Schones DE, Wang Z, Wei G, Chepelev I, Zhao K. High-resolution profiling of histone methylations in the human genome. Cell. 2007;129:823–837. - PubMed
    1. Bernstein BE, Mikkelsen TS, Xie X, Kamal M, Huebert DJ, Cuff J, Fry B, Meissner A, Wernig M, Plath K, et al. A bivalent chromatin structure marks key developmental genes in embryonic stem cells. Cell. 2006;125:315–326. - PubMed
    1. Birney E, Stamatoyannopoulos JA, Dutta A, Guigo R, Gingeras TR, Margulies EH, Weng Z, Snyder M, Dermitzakis ET, Thurman RE, et al. Identification and analysis of functional elements in 1% of the human genome by the ENCODE pilot project. Nature. 2007;447:799–816. - PMC - PubMed
    1. David G, Grandinetti KB, Finnerty PM, Simpson N, Chu GC, Depinho RA. Specific requirement of the chromatin modifier mSin3B in cell cycle exit and cellular differentiation. Proc Natl Acad Sci U S A. 2008;105:4168–4172. - PMC - PubMed
    1. Elsasser SJ, Allis CD, Lewis PW. Cancer. New epigenetic drivers of cancers. Science. 2011;331:1145–1146. - PubMed

Publication types

Associated data