. 2012 Jan 4;15(1):65-74.
doi: 10.1016/j.cmet.2011.11.010. Epub 2011 Dec 22.

Impaired generation of 12-hydroxylated bile acids links hepatic insulin signaling with dyslipidemia

Affiliations

Impaired generation of 12-hydroxylated bile acids links hepatic insulin signaling with dyslipidemia

Rebecca A Haeusler et al. Cell Metab. .

Abstract

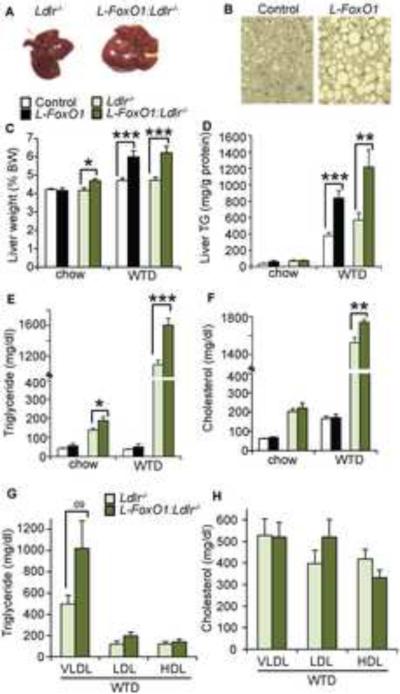
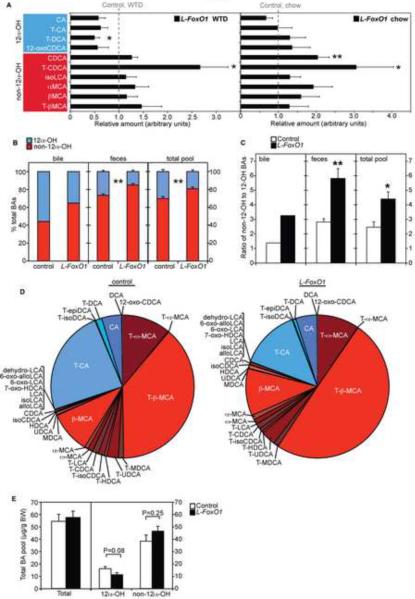
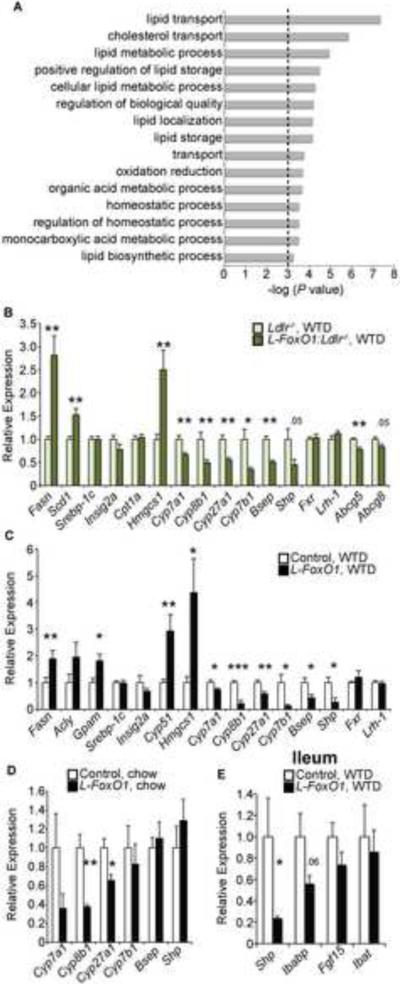
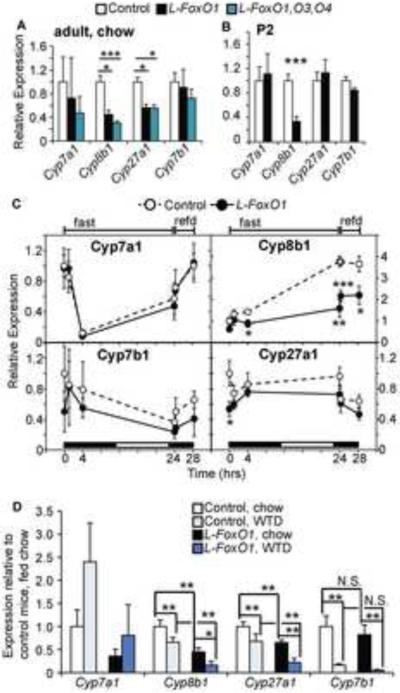
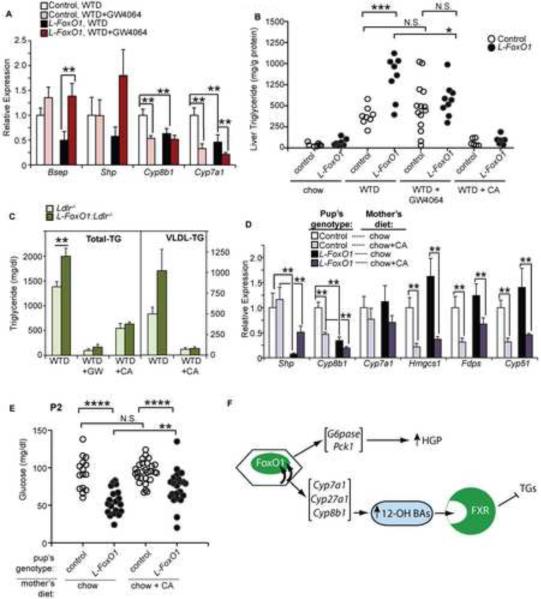
The association of type 2 diabetes with elevated plasma triglyceride (TG) and very low-density lipoproteins (VLDL), and intrahepatic lipid accumulation represents a pathophysiological enigma and an unmet therapeutic challenge. Here, we uncover a link between insulin action through FoxO1, bile acid (BA) composition, and altered lipid homeostasis that brings new insight to this longstanding conundrum. FoxO1 ablation brings about two signature lipid abnormalities of diabetes and the metabolic syndrome, elevated liver and plasma TG. These changes are associated with deficiency of 12α-hydroxylated BAs and their synthetic enzyme, Cyp8b1, that hinders the TG-lowering effects of the BA receptor, Fxr. Accordingly, pharmacological activation of Fxr with GW4064 overcomes the BA imbalance, restoring hepatic and plasma TG levels of FoxO1-deficient mice to normal levels. We propose that generation of 12α-hydroxylated products of BA metabolism represents a signaling mechanism linking hepatic lipid abnormalities with type 2 diabetes, and a treatment target for this condition.


Figures

Figure 1
Figure 1. Lipid parameters after WTD feeding
(A) Livers and (B) Hematoxylin and eosin staining of liver sections after WTD feeding. (C) Liver weights as a percentage of body weight (n=7–14). (D) Liver TG (n=7–8). (E) Total serum TG and (F) cholesterol in chow and WTD-fed L-FoxO1 and L-FoxO1:Ldlr−/− and respective controls, after a 5 hour fast (n=7–12). (G) Ultracentrifuge-fractionated TG and (H) cholesterol in WTD-fed L-FoxO1:Ldlr−/− and controls (n=5). *P<0.05, **P < 0.01, ***P < 0.001, by Student's t-tests. Data are presented as mean ± S.E.M. See also Figures S1 and S2.
Figure 2
Figure 2. Metabolomics and bile acid composition
(A) Hepatic BAs in L-FoxO1 mice, relative to controls, on WTD, and chow, separated by origination from 12α-hydroxylation (n=8). Note that 12-oxo-CDCA does not have a hydroxyl group at the 12 position, but it is derived by oxidation of CA by bacteria (Ridlon et al., 2006). A complete list of BA abbreviations is available in Supplemental Table 4. (B) 12α-OH (blue) and non-12α-OH (red) BAs, as a percentage of total in gallbladder bile (pooled from 5 mice per genotype), feces (n=3–4), and total BA pool (n=5–6), in WTD-fed L-FoxO1 mice and controls. (C) Ratio of non-12α-OH BAs to 12α-OH BAs in bile, feces, and total pool. (D) Composition of total BA pool in WTD-fed L-FoxO1 mice and controls (mean values of n=5–6). (E) Quantitation of total BAs, 12α-OH BAs and non-12α-OH BAs in the total BA pool from WTD-fed mice (n=5–6). *P < 0.05, **P < 0.01, by Welch's two-sample t-test (A) or Student's t-tests (B,C,E). Data are presented as mean ± S.E.M. See also Figure S3.
Figure 3
Figure 3. Gene expression changes due to hepatic FoxO1 ablation
(A) Gene ontology enrichment analysis, based on microarrays of liver tissue from WTD-fed L-FoxO1 and L-FoxO1:Ldlr−/− versus littermate controls. Only non-redundant pathways, where P< 0.001 for the pathway, are shown. (B–D) Relative hepatic gene expression by qPCR in (B) WTD-fed L-FoxO:Ldlr−/−, (C) WTD-fed L-FoxO1, and (D) chow-fed L-FoxO1 mice. (E) Relative gene expression by qPCR in ileum from WTD-fed L-FoxO1 mice. (n=6–7 for all) *P <0.05, **P < 0.01, ***P < 0.001, by Student's t-tests. Data are presented as mean ± S.E.M.
Figure 4
Figure 4. Regulation of BA synthetic genes
(A) Hepatic gene expression in chow-fed L-FoxO1 and L-FoxO1,O3,O4 mice. Values are shown relative to same-strain littermate controls (n=6–8). (B) Hepatic gene expression from mice sacrificed on postnatal day 2 (P2) (n=6). (C) Hepatic gene expression during a fasting-refeeding time course (n=5–6). Mice were fasted up to 24 hours, starting at 8pm, or fasted 24 hours then refed chow for 0.25 or 4.25 hours. Black and white boxes at the bottom of each graph indicate the light/dark cycle. (D) Comparison of gene expression on chow and WTD (n=6–7). *P<0.05, **P < 0.01, ***P < 0.001, by Student's t-tests (A–C) or two-way analysis of variance (D). Data are presented as mean ± S.E.M.
Figure 5
Figure 5. Defects in BA composition, lipid, and glucose metabolism in L-FoxO1 mice
(A) Hepatic gene expression showing FXR activation due to GW4064 treatment (n=6–7). (B) Liver TGs from L-FoxO1 and control mice fed WTD supplemented with either GW4064 (0.035%) or CA (0.5%) for 3 weeks. (C) Serum total and VLDL-TGs in L-FoxO1:Ldlr−/− and Ldlr−/− controls, after GW4064 (4 daily treatments orally) or supplementation of WTD with CA (1% for 1 week). For comparison in B and C, we also show lipid levels from mice fed chow and WTD (without treatment); these are the same mice whose mean values are shown in Figure 1. (D) Hepatic gene expression and (E) blood glucose levels from P2 neonates, where nursing mothers ate either chow or chow supplemented with CA. Expression of Cyp8b1 and Cyp7a1 from untreated mice are the same measurements presented in Figure 4B. (F) Model of metabolic functions of FoxO1 in liver. Data are presented as mean ± S.E.M. *P<0.05, **P < 0.01, ***P < 0.001, by Student's t-tests (B,C,E) or two-way analysis of variance (A,D). N.S.: not Significant; HGP: Hepatic Glucose Production. See also Figure S4.

References

    1. Akiyoshi T, Uchida K, Takase H, Nomura Y, Takeuchi N. Cholesterol gallstones in alloxan-diabetic mice. J Lipid Res. 1986;27:915–924. - PubMed
    1. Alnouti Y, Csanaky IL, Klaassen CD. Quantitative-profiling of bile acids and their conjugates in mouse liver, bile, plasma, and urine using LC-MS/MS. J Chromatogr B Analyt Technol Biomed Life Sci. 2008;873:209–217. - PMC - PubMed
    1. Angelin B, Einarsson K, Hellstrom K, Leijd B. Effects of cholestyramine and chenodeoxycholic acid on the metabolism of endogenous triglyceride in hyperlipoproteinemia. J Lipid Res. 1978;19:1017–1024. - PubMed
    1. Biddinger SB, Haas JT, Yu BB, Bezy O, Jing E, Zhang W, Unterman TG, Carey MC, Kahn CR. Hepatic insulin resistance directly promotes formation of cholesterol gallstones. Nat Med. 2008a;14:778–782. - PMC - PubMed
    1. Biddinger SB, Hernandez-Ono A, Rask-Madsen C, Haas JT, Aleman JO, Suzuki R, Scapa EF, Agarwal C, Carey MC, Stephanopoulos G, et al. Hepatic insulin resistance is sufficient to produce dyslipidemia and susceptibility to atherosclerosis. Cell Metab. 2008b;7:125–134. - PMC - PubMed

Publication types

MeSH terms