. 2012 Mar;96(1):124-31.
doi: 10.1016/j.exer.2011.12.011. Epub 2011 Dec 16.

Age-related changes in visual function in cystathionine-beta-synthase mutant mice, a model of hyperhomocysteinemia

Affiliations

Age-related changes in visual function in cystathionine-beta-synthase mutant mice, a model of hyperhomocysteinemia

Minzhong Yu et al. Exp Eye Res. 2012 Mar.

Abstract

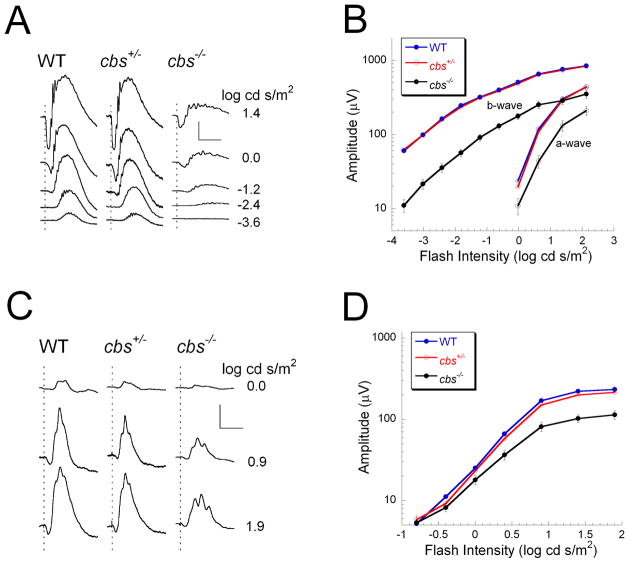
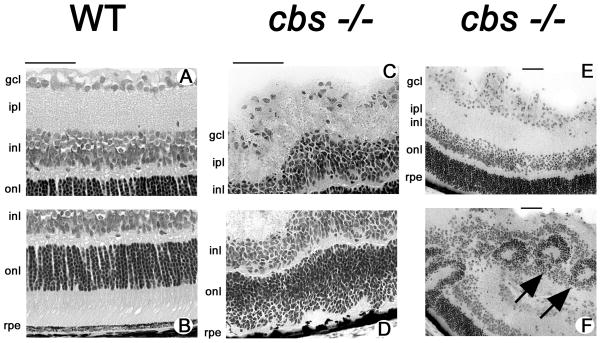
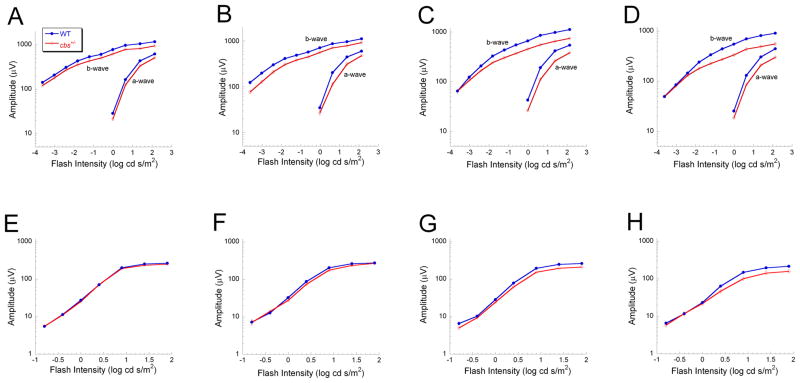
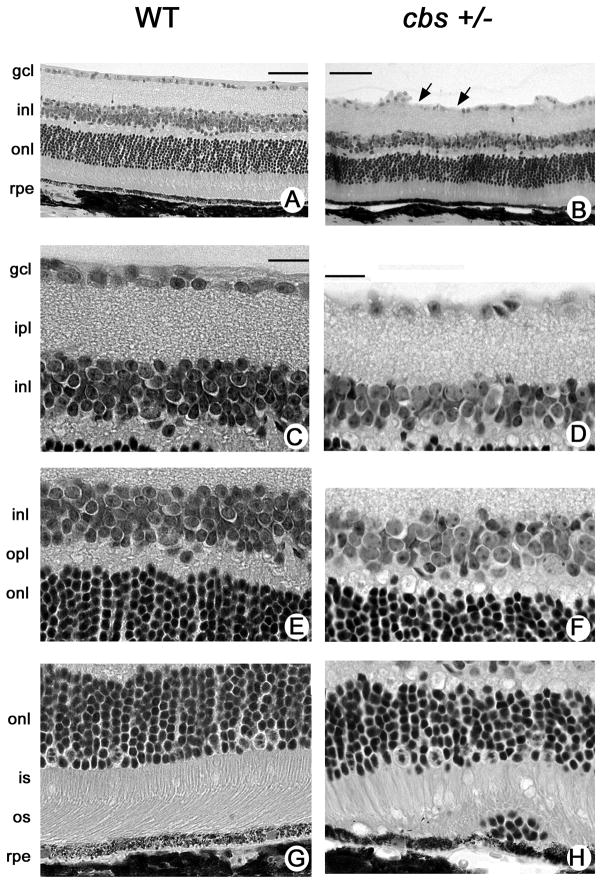
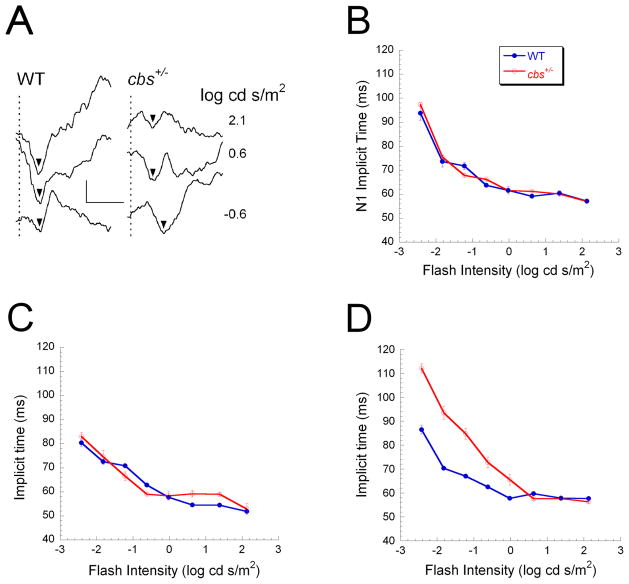
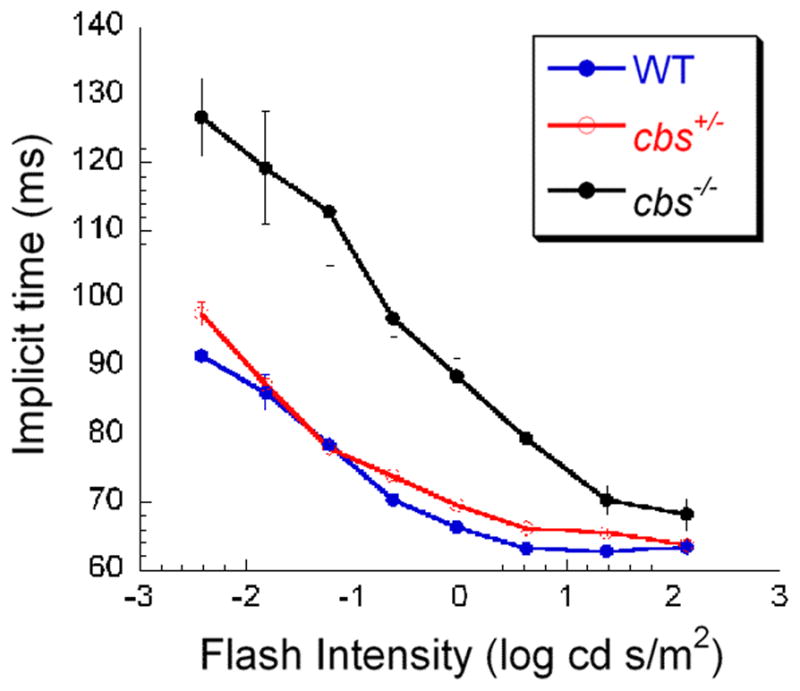
Homocysteine is an amino acid required for the metabolism of methionine. Excess homocysteine is implicated in cardiovascular and neurological disease and new data suggest a role in various retinopathies. Mice lacking cystathionine-beta-synthase (cbs(-/-)) have an excess of retinal homocysteine and develop anatomical abnormalities in multiple retinal layers, including photoreceptors and ganglion cells; heterozygous (cbs(+/-)) mice demonstrate ganglion cell loss and mitochondrial abnormalities in the optic nerve. The purpose of the present study was to determine whether elevated homocysteine, due to absent or diminished cbs, alters visual function. We examined cbs(-/-) (3 weeks) and cbs(+/-) mice (5, 10, 15, 30 weeks) and results were compared to those obtained from wild type (WT) littermates. Conventional dark- and light-adapted ERGs were recorded, along with dc-ERG to assess retinal pigment epithelial (RPE) function. The visual evoked potential (VEP) was used to assess transmission to the visual cortex. The amplitudes of the major ERG components were reduced in cbs(-/-) mice at age 3 weeks and VEPs were delayed markedly. These findings are consistent with the early retinal disruption observed anatomically in these mice. In comparison, at 3 weeks of age, responses of cbs(+/-) mice did not differ significantly from those of WT mice. Functional abnormalities were not observed in cbs(+/-) mice until 15 weeks of age, at which time amplitude reductions were noted for the ERG a- and b-wave and the light peak component, but not for other components generated by the RPE. VEP implicit times were delayed in cbs(+/-) mice at 15 and 30 weeks, while VEP amplitudes were unaffected. The later onset of functional defects in cbs(+/-) mice is consistent with a slow loss of ganglion cells reported previously in the heterozygous mutant. Light peak abnormalities indicate that RPE function is also compromised in older cbs(+/-) mice. The data suggest that severe elevations of homocysteine are associated with marked alterations of retinal function while modest homocysteine elevation is reflected in milder and delayed alterations of retinal function. The work lays the foundation to explore the role of homocysteine in retinal diseases such as glaucoma and optic neuropathy.


Figures

Figure 1
Figure 1
ERG results obtained from 3 week old mice. (A) ERGs obtained from WT (cbs+/+), cbs+/−, and cbs−/− mice to strobe flash stimuli presented to the dark-adapted eye. (B) Intensity-response functions for the major ERG components. Responses of WT and cbs+/− mice are not statistically different. Responses of cbs−/− mice are significantly reduced in amplitude (a-wave: p<0.02; b-wave: p<0.005). (C) Cone ERGs obtained to strobe flash stimuli superimposed upon a steady adapting field. (D) Intensity responses for the cone ERG. In comparison to WT, cone ERGs of cbs+/− mice are comparable in amplitude while cbs−/− mice are significantly reduced in amplitude (p<0.05). Scale bar in A indicates 200 μV and 100 ms. Scale bar in C indicates 100 μV and 100 ms. In B and D, data points indicate the average (± SD) of 19 WT, 26 cbs+/− and 4 cbs−/− mice.
Figure 2
Figure 2
Histology of retinas of 3 week old mice. Light micrographs of hematoxylin and eosin-stained inner (A) and outer (B) retinal regions in WT (cbs+/+) mice; inner (C) and outer (D) regions of homozygous mutant (cbs−/−) mice. Photomicrographs in E and F provide lower magnification of retinas of cbs−/− mice showing altered retinal architecture including rosette formation (arrows) within the nuclear layers. Calibration bar = 50 μm. Abbreviations: gcl = ganglion cell layer, ipl = inner plexiform layer, inl = inner nuclear layer, onl = outer nuclear layer, rpe = retinal pigment epithelium.
Figure 3
Figure 3
ERG changes in cbs+/− heterozygous mice. ERG intensity-response functions for WT and cbs+/− mice at 5 weeks (A, E), 10 weeks (B, F), 15 weeks (C, G) and 30 weeks (D, H) of age were obtained under dark-adapted (A–D) and light-adapted (E–H) conditions. For the dark-adapted condition, there was no significant difference between WT and cbs+/− mice at 5 or 10 weeks of age. At 15 and 30 weeks of age, both a- and b-waves were significantly reduced in cbs+/− mice (p<0.03). Light-adapted responses did not differ between WT and cbs+/− mice at 5 or 10 weeks of age, but cbs+/− responses were significantly reduced at 15 and 30 weeks of age (p<0.03 and 0.05, respectively). Data points indicate average (± SD) of 4–12 different mice.
Figure 4
Figure 4
Histology of retinas of 30 week old heterozygous and wildtype mice. Low magnification light micrographs of hematoxylin and eosin-stained retinas from (A) WT (cbs+/+) and (B) heterozygous (cbs+/−) mice. Higher magnification light photomicrograph images of inner (C,D), middle (E,F) and outer (G,H) retina of WT and cbs+/− mice, respectively. Generally, the laminar organization of the retina in cbs+/− mice is similar to that of WT mice, although the inner plexiform layer is slightly reduced in thickness and there is clear evidence of dropout of ganglion cells (arrows in panel B) in these retinas. There are occasional aberrations observed in the region of the RPE as shown in panel H. Calibration bar = A, B = 50 μm, C-H = 20μm. Abbreviations: gcl = ganglion cell layer, ipl = inner plexiform layer, inl = inner nuclear layer, opl = outer plexiform layer, onl = outer nuclear layer, is = inner segment, os = outer segment, rpe = retinal pigment epithelium.
Figure 5
Figure 5
Assessment of ERG components generated by the RPE. dc-ERG responses obtained to a 7-min duration stimulus were obtained from WT (blue) or cbs +/− (red) mice at 5 weeks (A) or 30 weeks (B) of age. At 5 weeks, tracings reflect the average of responses obtained from 9 WT or 3 cbs+/− mice. All response components were comparable at this age. At 30 weeks, tracings reflect the average of 9 WT or 4 cbs+/− responses. At 30 weeks of age, the amplitude of the light peak component was significantly reduced in amplitude (p<0.04). Amplitude scale bar indicates 1 mV.
Figure 6
Figure 6
VEP changes in cbs+/− heterozygous mice.. (A) Representative VEP waveforms of 30-week old WT and cbs +/− mice obtained to strobe flash stimuli presented to the dark-adapted eye. Arrowheads indicate the implicit time of the main VEP component N1. Vertical dashed lines indicate the time of stimulus flash presentation. Note that the delay observed in response to low intensity stimuli were more pronounced in the cbs +/− mouse. Scale bar indicates 20 μV and 100 ms. (B–D) Intensity-response functions for N1 implicit time obtained at 5 weeks (B), 10 weeks (C) and 30 weeks (D). Data points indicate the average (± SD) of 4 WT and 10 cbs+/−mice tested at 5 weeks of age, 7 WT and 3 cbs+/− mice tested at 10 weeks of age, and 7 WT and 9 cbs+/− mice tested at 30 weeks of age. N1 implicit time did not differ between WT and cbs+/−mice at 5 or 10 weeks of age. N1 implicit times were significantly delayed in 30 week old cbs+/−mice (p<0.05).
Figure 7
Figure 7
Visual evoked potential in 3 week homozygous mice compared to age-matched heterozygous and wildtype mice. Intensity-response functions for N1 implicit time were obtained from 3-week old WT (blue), cbs+/− (red) and cbs+/− (black) mice. Note the pattern of VEP delay observed in older cbs+/− mice (Fig. 6) is already detectable by 3-weeks in the cbs−/− animals.

References

    1. Axer-Siegel R, Bourla D, Ehrlich R, et al. Association of neovascular age-related macular degeneration and hyperhomocysteinemia. Am J Ophthalmol. 2004;137:84–89. - PubMed
    1. Aydemir O, Türkçüğlu P, Güler M, Celiker U, Ustündağ B, Yilmaz T, Metin K. Plasma and vitreous homocysteine concentrations in patients with proliferative diabetic retinopathy. Retina. 2008;28:741–743. - PubMed
    1. Bleich S, Jünemann A, Von Ahsen N, et al. Homocysteine and risk of open-angle glaucoma. J Neural Transm. 2002;109:1499–1504. - PubMed
    1. Carelli V, Ross-Cisneros FN, Sadun AA. Mitochondrial dysfunction as a cause of optic neuropathies. Prog Retin Eye Res. 2004;1:53–89. - PubMed
    1. Chang HH, Lin DP, Chen YS, Liu HJ, Lin W, Tsao ZJ, Teng MC, Chen BY. Intravitreal homocysteine-thiolactone injection leads to the degeneration of multiple retinal cells, including photoreceptors. Mol Vis. 2011;17:1946–1956. - PMC - PubMed

Publication types

MeSH terms