. 2011 Dec 25;15(2):321-7.
doi: 10.1038/nn.3001.

Anatomical connectivity patterns predict face selectivity in the fusiform gyrus

Affiliations

Anatomical connectivity patterns predict face selectivity in the fusiform gyrus

Zeynep M Saygin et al. Nat Neurosci. .

Abstract

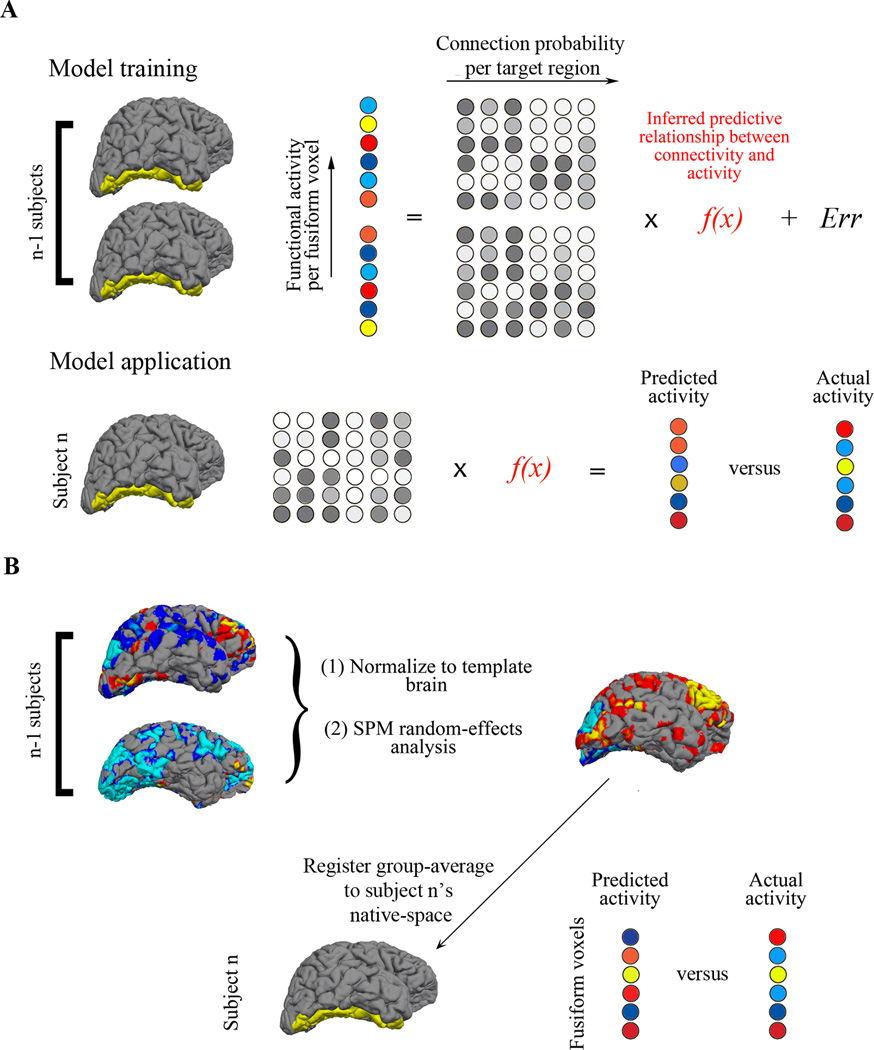
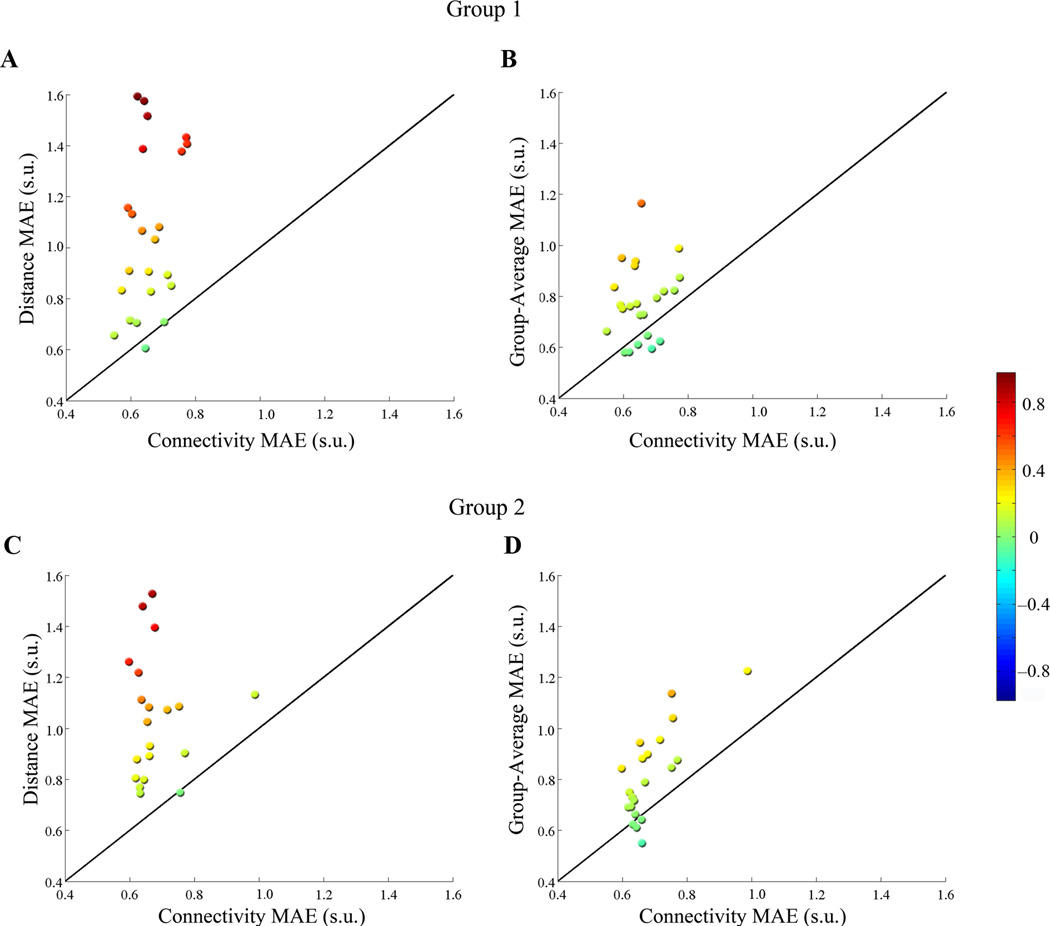
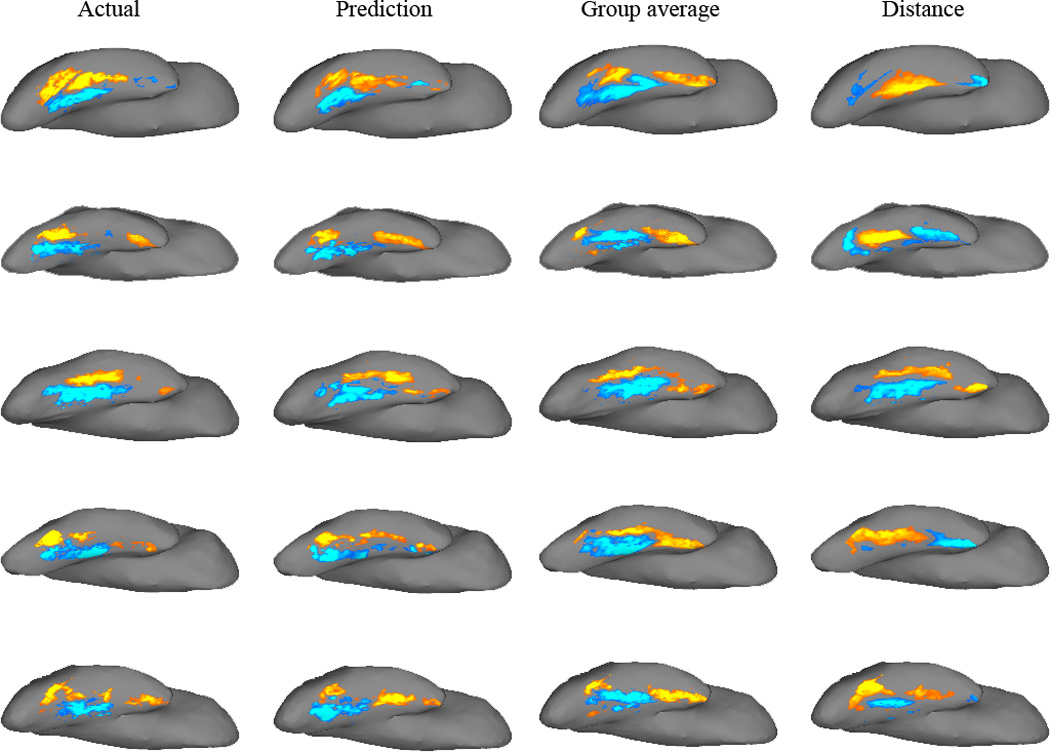
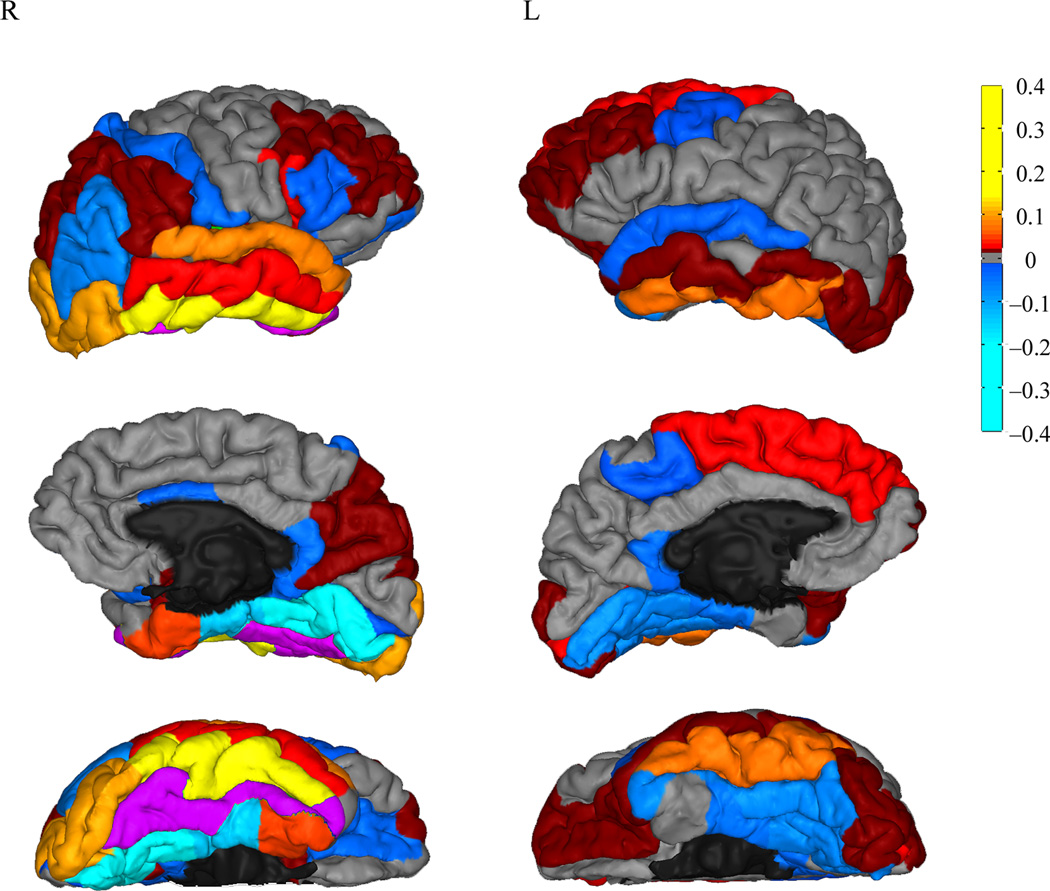
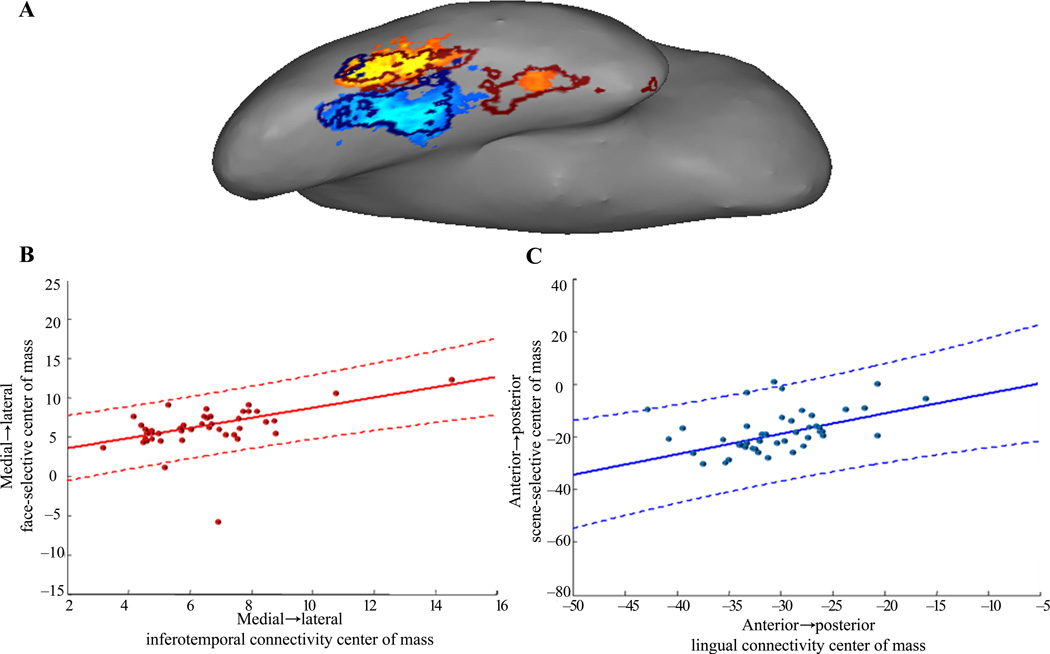
A fundamental assumption in neuroscience is that brain structure determines function. Accordingly, functionally distinct regions of cortex should be structurally distinct in their connections to other areas. We tested this hypothesis in relation to face selectivity in the fusiform gyrus. By using only structural connectivity, as measured through diffusion-weighted imaging, we were able to predict functional activation to faces in the fusiform gyrus. These predictions outperformed two control models and a standard group-average benchmark. The structure-function relationship discovered from the initial participants was highly robust in predicting activation in a second group of participants, despite differences in acquisition parameters and stimuli. This approach can thus reliably estimate activation in participants who cannot perform functional imaging tasks and is an alternative to group-activation maps. Additionally, we identified cortical regions whose connectivity was highly influential in predicting face selectivity within the fusiform, suggesting a possible mechanistic architecture underlying face processing in humans.


Figures

Figure 1
Figure 1. Schematic model design
(a) Linear regression models were trained on all but one participant’s data in Group 1. The 22 participants’ fMRI data for each voxel in the fusiform gyrus are depicted by circles that are color-coded from red to blue, representing their responses to the contrast of Faces >Scenes). Each voxel’s corresponding connection probabilities (for the connectivity model) or Euclidian distances (for the distance model) to each target brain region are depicted by the grayscale circles. The fMRI data and connectivity or distance data from each fusiform voxel for the 22 participants are used to train the model, and the resulting model, f(x), is applied to the remaining participant’s connectivity or distance data, resulting in predicted fMRI values for each fusiform voxel. The predicted values are then compared to that participant’s observed fMRI values and the mean absolute error (MAE) is calculated for each participant. The LOOCV is done iteratively through all the participants, such that each participant has a predicted fMRI image based on a regression from all the other participants. (b) Similarly, a LOOCV procedure was also performed for the group-average model, but rather than training a linear regression, each participant’s whole-brain fMRI data was spatially normalized into MNI space, superimposed to create composite maps, and a t-static image was generated for the random-effects analysis. This image was registered to the remaining participant’s native-space, and only the fusiform gyrus was extracted. This predicted activation based on a group analysis was then compared to that participant’s observed activation, and an MAE was computed per voxel.
Figure 2
Figure 2
Benchmark comparisons per participant. MAE’s from the connectivity-based predictions are plotted against distance or group-average MAE’s for each participant. Participants above the unity line thus have higher (worse) MAE’s for the benchmark than for the connectivity-based model. Colors reflect the difference between the connectivity-based model and the benchmark; hotter colors indicate better performance of the connectivity-based model. (a) For 21/23 participants in group 1, the distance-based predictions had higher (worse) MAE’s than connectivity-based predictions, and no participants’ functional activation was better predicted by distance than by connectivity. (b) The connectivity-based model predicted actual fMRI activation with fewer errors than the group-average for 17/23 participants, while 2 participants’ functional activation was better predicted by the group-average than by connectivity. (c) For 18/21 participants in group 2, connectivity-based predictions better predicted actual activations than distance-based predictions, while no participants’ functional activation was better predicted by distance than by connectivity. (d) 16/21 participants from group 2 had lower MAE’s with the connectivity model, while 1 participant had lower MAE’s with the group-average model.
Figure 3
Figure 3
Actual and predicted fMRI activation to Faces>Scenes in the fusiform gyrus of five example participants. For each participant, actual and predicted activation images (t-statistic values for Faces>Scenes) were up-sampled from the DWI structural image (where all the analyses were performed) to the same participant’s structural scan, and projected onto the participant’s inflated brain surface. Each row is a single participant; the leftmost column displays the actual fMRI activation pattern in the right fusiform gyrus. The remaining columns illustrate, from left to right, predicted fMRI images from: connectivity, group-average, and distance.
Figure 4
Figure 4
Beta weights for each target region from the final connectivity model. Target regions are color-coded from hot-to-cold to reflect positive or negative beta weight values, and projected to the pial surface of an example participant, with the lateral view on the top row, medial view on the second row, and ventral view on the bottom. The highest predictors of face-selective voxels are regions labeled from red-to-yellow, while the highest predictors of scene-selective voxels are those labeled from blue-to-light blue. The seed region is highlighted in purple. See Results for the anatomical nomenclature of the target regions.
Figure 5
Figure 5. Spatial relationship of function with connection strength to the highest predictors
(a) Functional activation of an example participant, with the thresholded boundaries of inferotemporal connectivity overlaid in dark red, and boundaries of lingual connectivity overlaid in dark blue. (b) Each participant’s center-of-mass of connectivity to inferotemporal is plotted against their center-of-mass of positively-responding voxels, along the medial-lateral dimension, along which each participant’s connectivity varies alongside face-selectivity. (c) Centroids of lingual connectivity, plotted against centroids of negatively-responding voxels, along the anterior-posterior dimension. Solid lines in b and c are the least-square fits of these data, and dashed lines are their 99% confidence intervals.

Comment in

References

    1. Johansen-Berg H, et al. Changes in connectivity profiles define functionally distinct regions in human medial frontal cortex. Proceedings of the National Academy of Sciences of the United States of America. 2004;101:13335. - PMC - PubMed
    1. Passingham RE, Stephan KE, Kotter R. The anatomical basis of functional localization in the cortex. Nat Rev Neurosci. 2002;3:606–616. - PubMed
    1. Haxby JV, et al. The effect of face inversion on activity in human neural systems for face and object perception. Neuron. 1999;22:189–199. - PubMed
    1. Tsao DY, Schweers N, Moeller S, Freiwald WA. Patches of face-selective cortex in the macaque frontal lobe. Nat Neurosci. 2008;11:877–879. - PMC - PubMed
    1. Perrett DI, Hietanen JK, Oram MW, Benson PJ. Organization and functions of cells responsive to faces in the temporal cortex. Philos Trans R Soc Lond B Biol Sci. 1992;335:23–30. - PubMed

Publication types