. 2012 Mar;63(5):2007-24.
doi: 10.1093/jxb/err400. Epub 2011 Dec 23.

NO, ROS, and cell death associated with caspase-like activity increase in stress-induced microspore embryogenesis of barley

Affiliations

NO, ROS, and cell death associated with caspase-like activity increase in stress-induced microspore embryogenesis of barley

María Rodríguez-Serrano et al. J Exp Bot. 2012 Mar.

Abstract

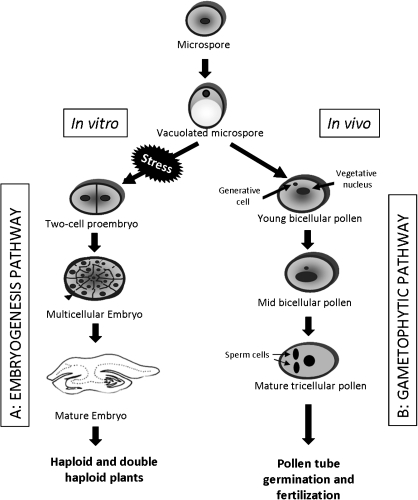
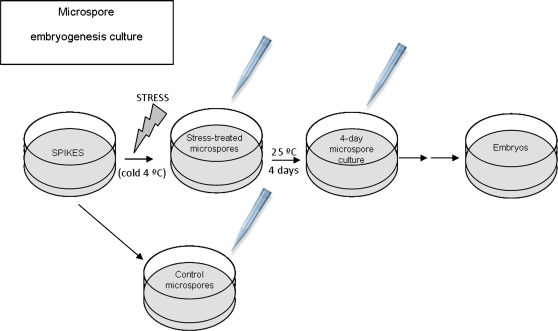
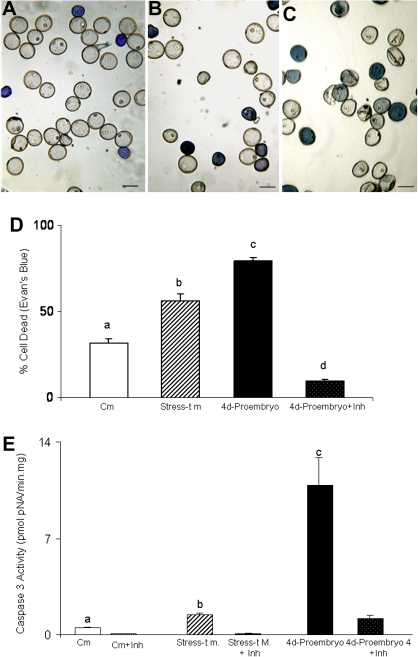
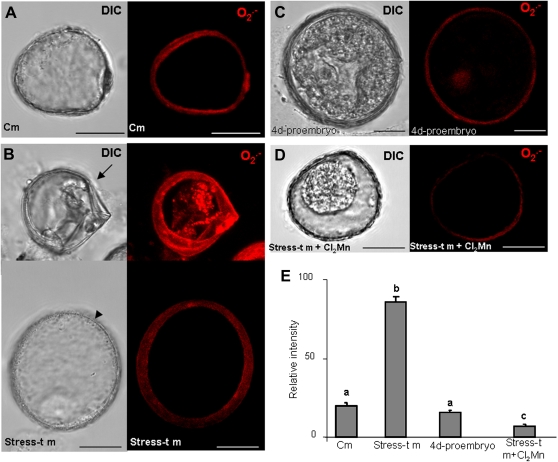
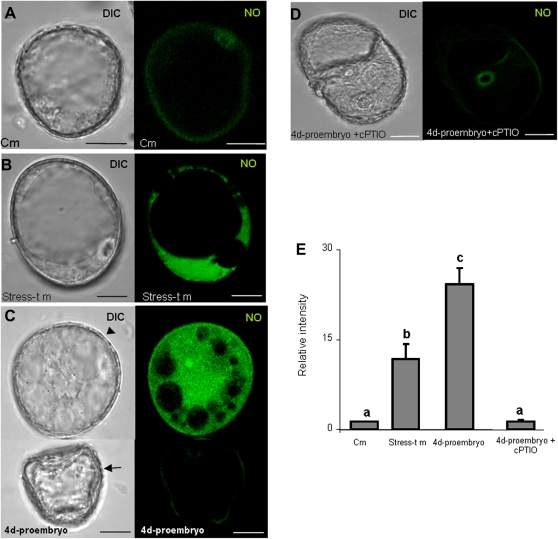
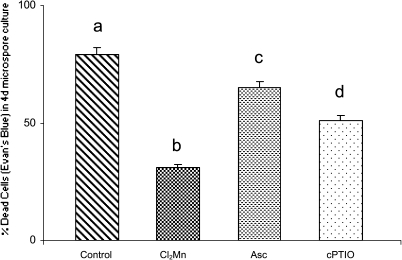
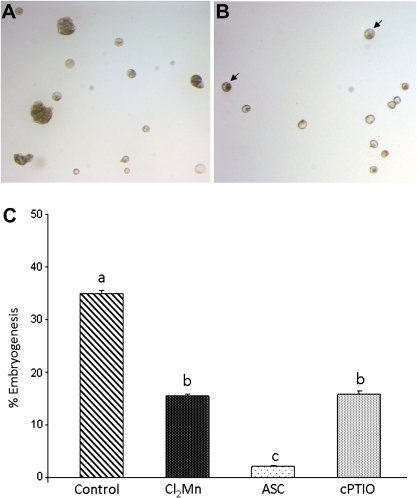
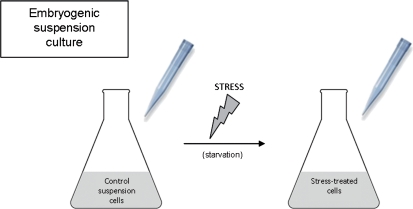
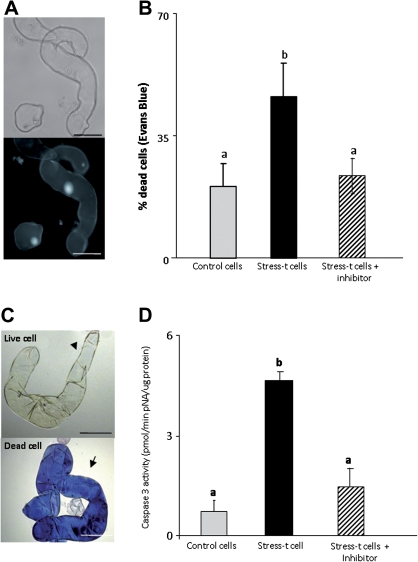
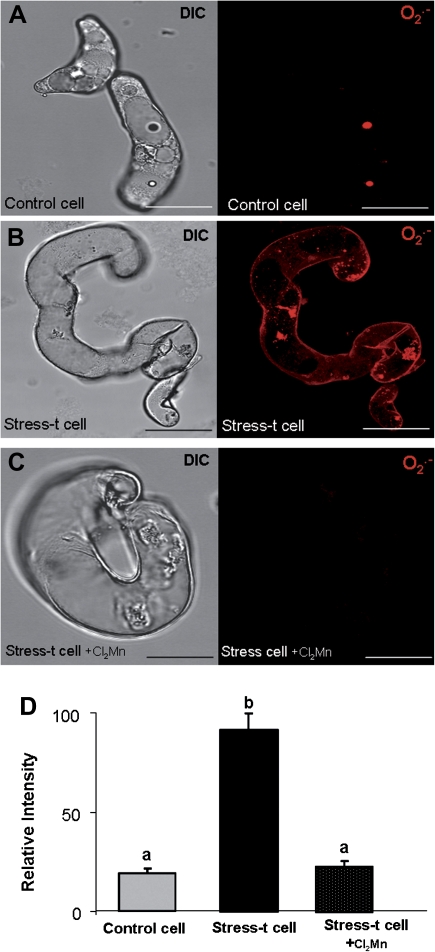
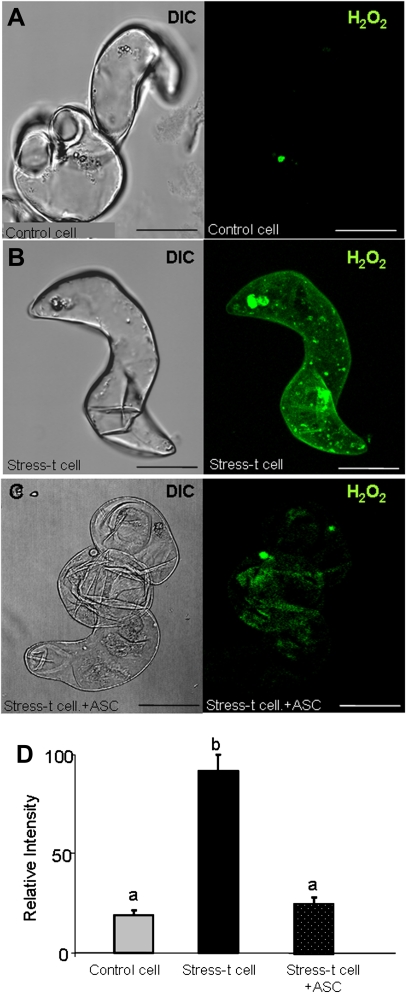
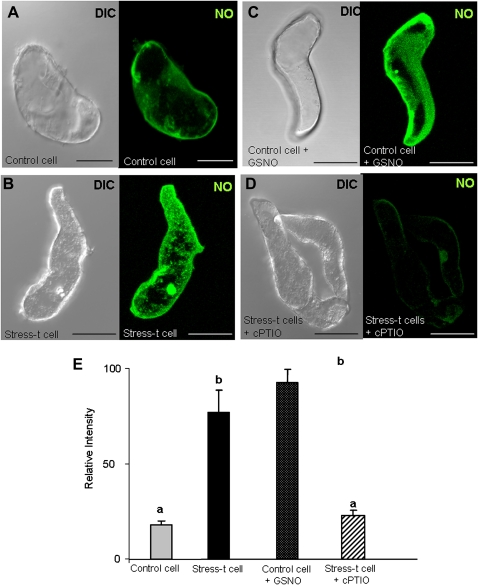
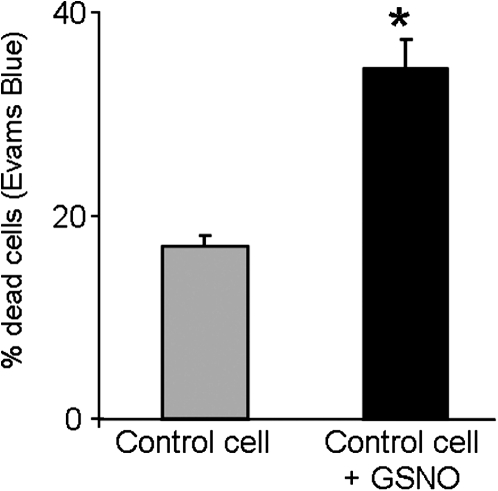
Under specific stress treatments (cold, starvation), in vitro microspores can be induced to deviate from their gametophytic development and switch to embryogenesis, forming haploid embryos and homozygous breeding lines in a short period of time. The inductive stress produces reactive oxygen species (ROS) and nitric oxide (NO), signalling molecules mediating cellular responses, and cell death, modifying the embryogenic microspore response and therefore, the efficiency of the process. This work analysed cell death, caspase 3-like activity, and ROS and NO production (using fluorescence probes and confocal analysis) after inductive stress in barley microspore cultures and embryogenic suspension cultures, as an in vitro system which permitted easy handling for comparison. There was an increase in caspase 3-like activity and cell death after stress treatment in microspore and suspension cultures, while ROS increased in non-induced microspores and suspension cultures. Treatments of the cultures with a caspase 3 inhibitor, DEVD-CHO, significantly reduced the cell death percentages. Stress-treated embryogenic suspension cultures exhibited high NO signals and cell death, while treatment with S-nitrosoglutathione (NO donor) in control suspension cultures resulted in even higher cell death. In contrast, in microspore cultures, NO production was detected after stress, and, in the case of 4-day microspore cultures, in embryogenic microspores accompanying the initiation of cell divisions. Subsequent treatments of stress-treated microspore cultures with ROS and NO scavengers resulted in a decreasing cell death during the early stages, but later they produced a delay in embryo development as well as a decrease in the percentage of embryogenesis in microspores. Results showed that the ROS increase was involved in the stress-induced programmed cell death occurring at early stages in both non-induced microspores and embryogenic suspension cultures; whereas NO played a dual role after stress in the two in vitro systems, one involved in programmed cell death in embryogenic suspension cultures and the other in the initiation of cell division leading to embryogenesis in reprogrammed microspores.


Figures

Fig. 1.
Fig. 1.
Embryogenic and gametophytic developmental pathways of the microspore. Scheme representing the main stages of the two developmental pathways that the microspore can undergo. (A) Embryogenic pathway: by stress treatment in vitro, the vacuolated microspore is reprogrammed and follows an embryogenic pathway forming embryos that further regenerate haploid and double-haploid plants. (B) Gametophytic pathway: in vivo, the microspore undergoes the gametophytic development leading to mature pollen which further germinates and carries out fertilization.
Fig. 2.
Fig. 2.
Stress-induced embryogenesis in isolated barley microspore cultures and plantlet regeneration. (A) Isolated microspores at culture initiation. (B) Microspore-derived embryos after 28 days in culture. (C) Germination of microspore-derived embryos. (D) Regenerated plantlet in solid MS medium. Bars, 0.2 mm (A), 10 mm (B–D). (This figure is available in colour at JXB online.)
Fig. 3.
Fig. 3.
Cellular monitoring at early stages of barley microspore embryogenesis. (A,E,I) Vacuolated microspores at culture inititation. (B,F,J) Pro-embryo after 4 days in culture surrounded by the microspore wall, the exine. (C,G,K) Multicellular pro-embryos after 10 days in culture, with broken exine. (D,H,L) Multicellular embryo without exine after 15 days in culture. Squash preparations observed by differential interference contrast microscopy (DIC, A–D), after 4′,6-diamidino-2-phenylindole staining to reveal nuclei (DAPI, E–H), and semi-thin sections stained with toluidine blue for general structural analysis (Toluidine, I–L). C, cytoplasm; E, exine; N, nucleus; V, vacuole. Bars, 20 μm. (This figure is available in colour at JXB online.)
Fig. 4.
Fig. 4.
Scheme of microspore embryogenesis culture and collection of samples for analysis. Micropipette tips point to the three stages of sample collection: control microspores, stress-treated microspores, and 4-day microspore culture.
Fig. 5.
Fig. 5.
Cell death and caspase 3-like activity in barley microspore cultures. (A–C) Evans Blue staining revealing dead microspores as blue cells: (A) control microspores, before the stress treatment; (B) stress-treated microspores; (C) microspore culture 4 days after stress; bars, 20 μm. (D) Histogram showing the percentage of dead cells identified by Evans Blue staining, in control microspores (Cm) and the three stages illustrated in the micrographs. (E) Caspase 3-like activity in the three stages, with the caspase 3 inhibitors (+Inh) as negative controls. Stress-t m, stress-treated microspores. Letters indicate significant differences at P < 0.05 according to Duncan’s multiple-range test. (This figure is available in colour at JXB online.)
Fig. 6.
Fig. 6.
Imaging of O2.− production in barley microspore cultures with a dihydroethidium (DHE)-specific probe and confocal analysis. (A–D) Micrographs showing the differential interference contrast microscopy (DIC) image and the O2.− -dependent DHE fluorescence in red (maximum projection of several optical sections): (A) control microspore with no signal for O2.− ; (B) stress-treated microspores: in the upper image, a small cell with contracted cytoplasm, typically a non-embryogenic cell (arrow), with high O2.− fluorescence; in the lower image, a bigger rounded cell, typically an embryogenic microspore (arrowhead), with no O2.− signal; (C) 4-day pro-embryo, negative to O2.− fluorescence; (D) negative control in stress-treated microspores after incubation with Cl2Mn (O2.− scavenger); bars, 15 μm. (E) Histogram showing the relative fluorescence intensities of control microspores (Cm) and the three stages illustrated in the micrographs. Stress-t m, stress-treated microspores. Letters indicate significant differences at P < 0.05 according to Duncan’s multiple-range test. (This figure is available in colour at JXB online.)
Fig. 7.
Fig. 7.
Imaging of NO production in barley microspore cultures with 4,5-diaminoflorescein diacetate (DAF-2DA)-specific probe and confocal analysis. (A–D) Micrographs showing the differential interference contrast microscopy (DIC) image and the NO-dependent DAF-2DA fluorescence in green (maximum projection of several optical sections): (A) control microspore with no signal for NO; (B) stress-treated microspore with a rounded shape and big size corresponding to an embryogenic microspore, showing NO fluorescence signal in cytoplasm, the large vacuole appears negative; (C) microspores after 4 days in culture: in the upper image a bigger rounded cell, typically a 4-day embryogenic microspore or pro-embryo (arrowhead), with high NO signal; in the lower image, a smaller cell with contracted cytoplasm, typically a non-embryogenic cell (arrow), showing no NO fluorescence; (D) negative control in 4-day-pro-embryo after incubation with cPTIO, NO scavenger; bars, 15 μm; (E) histogram showing the relative fluorescence intensities for the control (Cm) and the three stages illustrated in the micrographs. Stress-t m, stress-treated microspores. Letters indicate significant differences at P < 0.05 according to Duncan’s multiple-range test.
Fig. 8.
Fig. 8.
Effect of treatments with ROS and NO scavengers on stress-induced cell death in microspore cultures. Histogram indicating the percentage of dead cells, detected by Evans Blue, in microspore cultures 4 days after the stress treatment, without scavengers (control) or with treatments with Cl2Mn (O2.− scavenger), ascorbate (Asc, H2O2 scavenger), or cPTIO (NO scavenger). Different letters indicate significant differences at P < 0.05 according to Duncan’s multiple-range test.
Fig. 9.
Fig. 9.
Effect of treatments with ROS and NO scavengers on the percentage of microspore embryogenesis. (A) Control microspore culture at 20 days after the inductor stress treatment, micrograph showing large developing embryos (arrowheads), dense and large multicellular microspores (arrows), and small non-embryogenic microspores; bar, 50 μm. (B) Microspore culture treated with the NO scavenger, cPTIO, for 20 days after the inductor stress treatment, exhibiting some dense and large multicellular microspores (arrow) and many small non-embryogenic microspores; bar, 50 μm. (C) Histogram indicating the percentage of embryogenic structures (large embryos and multicellular microspores) in microspore cultures 20 days after the inductor stress treatment, without scavengers (control) or with treatments with Cl2Mn (O2.− scavenger), ascorbate (Asc, H2O2 scavenger), or cPTIO (NO scavenger). Different letters indicate significant differences at P < 0.05 according to Duncan’s multiple-range test. (This figure is available in colour at JXB online.)
Fig. 10.
Fig. 10.
Scheme of embryogenic suspension culture and collection of samples for analysis. Micropipette tips point to the two stages of sample collection: control suspension cells and stress-treated cells. (This figure is available in colour at JXB online.)
Fig. 11.
Fig. 11.
Cell death and caspase 3-like activity in barley embryogenic suspension cultures. (A) Cells of suspension culture visualized by differential interference contrast microscopy (upper) and 4′,6-diamidino-2-phenylindole staining for DNA revealing the nuclei (lower); bar, 45 μm. (B) Histogram showing the percentage of dead cells identified by Evans Blue staining in control and stress-treated cells. (C) Evans Blue staining revealing dead cells in blue (arrow) and living cells unstained (arrowhead); bar, 45 μm. (D) Caspase 3-like activity in control and stress-treated cells, as well as in stress-treated cells with the caspase 3 inhibitor as control. Letters indicate significant differences at P < 0.05 according to Duncan’s multiple-range test (This figure is available in colour at JXB online.)
Fig. 12.
Fig. 12.
Imaging of O2.− production in barley suspension cell cultures with a dihydroethidium (DHE)-specific probe and confocal analysis. (A–D) Micrographs showing the differential interference contrast microscopy (DIC) image and the O2.− -dependent DHE fluorescence in red (maximum projection of several optical sections): (A) control cells; (B) O2.− production in stress-treated cells; (C) negative control: stress-treated cells incubated with Cl2Mn, O2.− scavenger; bars, 45 μm. (D) Histogram showing relative fluorescence intensities reflecting differences between treatments. Stress-t cell, stress-treated cells. Letters indicate significant difference at P < 0.001 according to Duncan’s multiple-range test. (This figure is available in colour at JXB online.)
Fig. 13.
Fig. 13.
Imaging of H2O2 production in barley embryogenic suspension cultures with a 2′,7′-dichlorofluorescein diacetate (DCF-DA)-specific probe and confocal analysis. (A–C) Micrographs showing the differential interference contrast microscopy (DIC) image and the H2O2-dependent DCF-DA fluorescence in red (maximum projection of several optical sections): (A) control cells; (B) H2O2 production in stress-treated cells. (C) negative control: stress-treated cells incubated with ascorbate (ASC, H2O2 scavenger); bars, 45 μm. (D) Histogram showing relative fluorescence intensities reflecting differences between treatments. Stress-t cell, stress-treated cells. Letters indicate significant difference at P < 0.001 according to Duncan’s multiple-range test. (This figure is available in colour at JXB online.)
Fig. 14.
Fig. 14.
Imaging of NO production in barley embryogenic suspension cultures with 4,5-diaminoflorescein diacetate (DAF-2DA)-specific probe and confocal analysis. (A–D) Micrographs showing the differential interference contrast microscopy (DIC) image and the NO-dependent DAF-2DA fluorescence in green (maximum projection of several optical sections); (A) control cell showing a faint NO signal; (B) high NO production in stress-treated cells; (C) control cell treated with the NO donor GSNO, exhibiting a high NO signal; (D) negative control: stress-treated cells incubated with cPTIO, NO scavenger; bars, 45 μm. (E) Histogram showing relative fluorescence intensities reflecting differences between treatments. Stress-t cell, stress-treated cells. Letters indicate significant difference at P < 0.001 according to Duncan’s multiple-range test. (This figure is available in colour at JXB online.)
Fig. 15.
Fig. 15.
Quantification of cell death induced by exogenous NO in barley embryogenic suspension cultures. Histogram showing the percentage of dead cells detected by Evans Blue staining in control suspension cell cultures (control cell) and suspension cultures treated with the NO donor GSNO for 2 days. Asterisk indicates significant difference at P < 0.05 according to Duncan’s multiple-range test.

Similar articles

Cited by

References

    1. Apel K, Hirt H. Reactive oxygen species: metabolism, oxidative stress, and signal transduction. Annual Review of Plant Biology. 2004;55:373–399. - PubMed
    1. Arnaud N, Murgia I, Boucherez J, Briat JF, Cellier F, Gaymard F. An iron-induced nitric oxide burst precedes ubiquitin-dependent protein degradation for Arabidopsis AtFer1 ferritin gene expression. Journal of Biological Chemistry. 2006;281:23579–23588. - PubMed
    1. Balestrazzi A, Agoni V, Tava A, Avato P, Biazzi E, Raimondi E, Macovei A, Carbonera D. Cell death induction and nitric oxide biosynthesis in white poplar (Populus alba) suspension cultures exposed to alfalfa saponins. Physiologia Plantarum. 2011;141:227–238. - PubMed
    1. Bárány I, Fadón B, Risueño MC, Testillano PS. Cell wall components and pectin esterification levels as markers of proliferation and differentiation events during pollen development and embryogenesis. Journal of Experimental Botany. 2010;61:1159–1175. - PMC - PubMed
    1. Beligni MV, Lamattina L. Nitric oxide in plants: the history is just beginning. Plant, Cell and Environment. 2001;24:267–278.

Publication types

MeSH terms