. 2011 Dec;23(12):4428-45.
doi: 10.1105/tpc.111.093179. Epub 2011 Dec 23.

Phloem ultrastructure and pressure flow: Sieve-Element-Occlusion-Related agglomerations do not affect translocation

Affiliations

Phloem ultrastructure and pressure flow: Sieve-Element-Occlusion-Related agglomerations do not affect translocation

Daniel R Froelich et al. Plant Cell. 2011 Dec.

Abstract

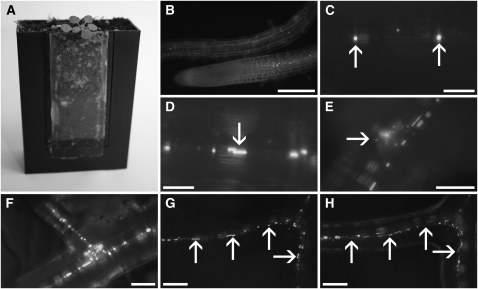
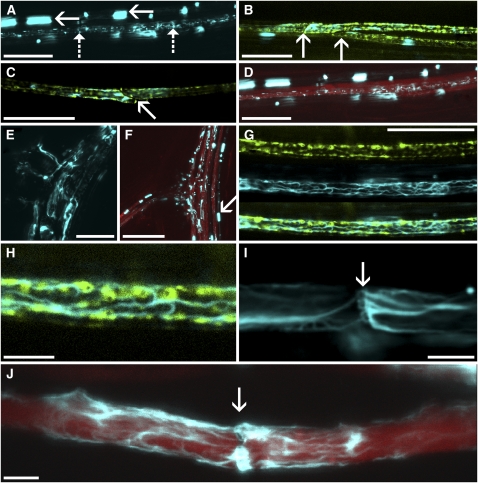
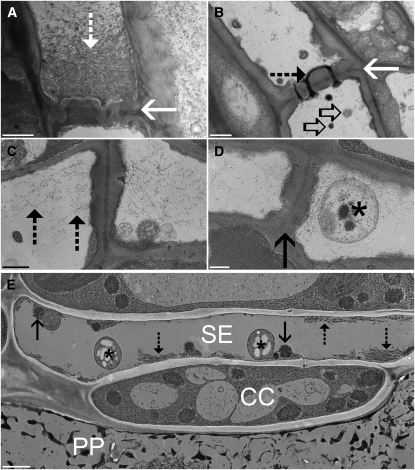
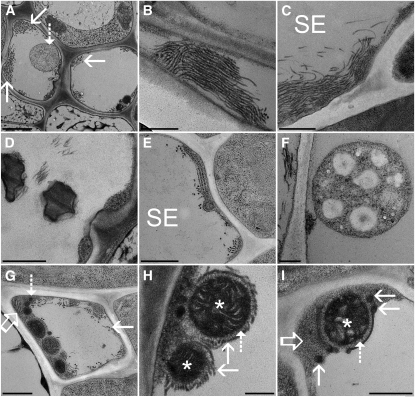
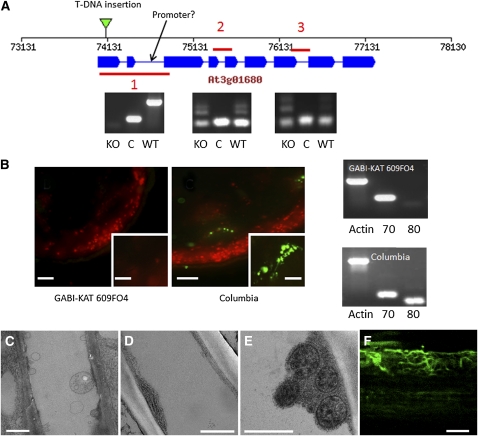
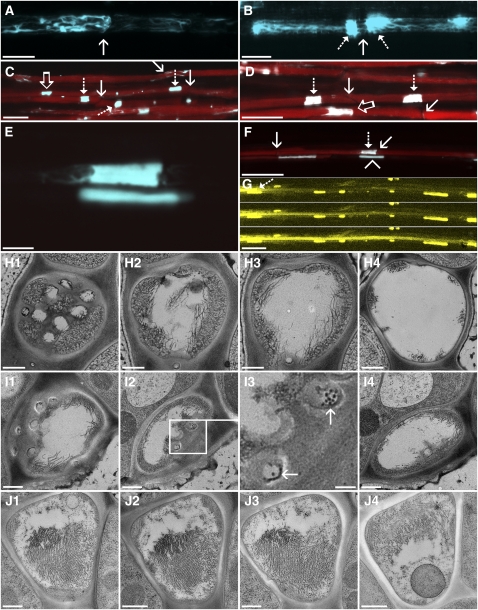
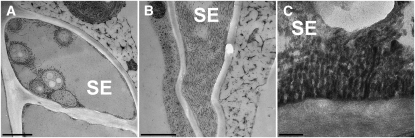
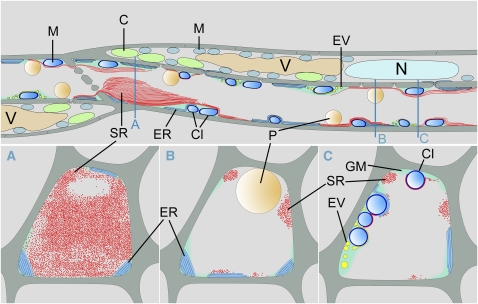
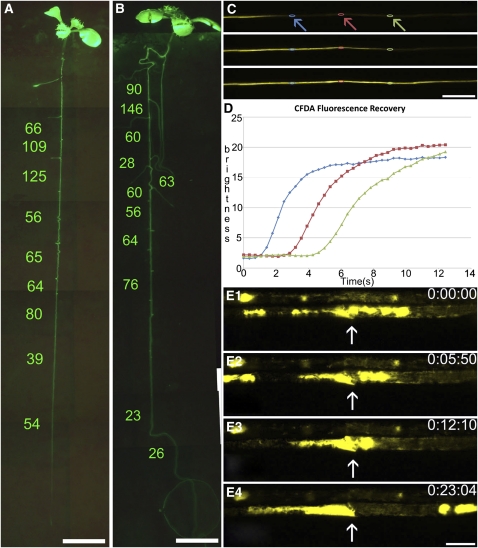
Since the first ultrastructural investigations of sieve tubes in the early 1960s, their structure has been a matter of debate. Because sieve tube structure defines frictional interactions in the tube system, the presence of P protein obstructions shown in many transmission electron micrographs led to a discussion about the mode of phloem transport. At present, it is generally agreed that P protein agglomerations are preparation artifacts due to injury, the lumen of sieve tubes is free of obstructions, and phloem flow is driven by an osmotically generated pressure differential according to Münch's classical hypothesis. Here, we show that the phloem contains a distinctive network of protein filaments. Stable transgenic lines expressing Arabidopsis thaliana Sieve-Element-Occlusion-Related1 (SEOR1)-yellow fluorescent protein fusions show that At SEOR1 meshworks at the margins and clots in the lumen are a general feature of living sieve tubes. Live imaging of phloem flow and flow velocity measurements in individual tubes indicate that At SEOR1 agglomerations do not markedly affect or alter flow. A transmission electron microscopy preparation protocol has been generated showing sieve tube ultrastructure of unprecedented quality. A reconstruction of sieve tube ultrastructure served as basis for tube resistance calculations. The impact of agglomerations on phloem flow is discussed.


Figures

Figure 1.
Figure 1.
Epifluorescence of SEOR1-YFP in Living Roots. (A) An Arabidopsis plant grown in a Micro-ROC. The root hairs of the plant are in contact with the soil, while the roots are forced to grow along the cover slip. (B) A root tip and a young part of a root as observed by epifluorescence in a Micro-ROC. Cells were stained with synapto-red to visualize cell outline. Bright spots along the root are SEOR1-YFP fusion proteins. The image is a single frame of Supplemental Movie 1 online. (C) and (D) Higher magnification of SEOR1-YFP fusion proteins (C). In young vascular tissue, the proteins appear as round amorphous bodies (arrows), which increase in size and become elongated in consecutive slightly older areas ([D], arrow). (E) Early indication of root branch formation is the abundance of SEOR1-YFP bodies beside the file (arrow). (F) After the root tip broke through the cortical layer, a new vascular file formed. (G) A root containing numerous amorphous bodies in a file (arrows). (H) Ten hours later, the amorphous bodies have developed into more defined structures (arrows). Bars = 150 μm in (B), 25 μm in (C) and (D), 50 μm in (E) and (F), and 100 μm in (G) and (H).
Figure 2.
Figure 2.
In Vivo Observation of Sieve Tube Structure. (A) SEOR1-YFP fusion protein distribution within vascular bundles shows files containing amorphous bodies (solid arrows) and files containing fine strands (dashed arrows). (B) and (C) GFP specifically tagged to the sieve tube ER (green) reveals that SEOR1-YFP (cyan) is located in sieve elements. Arrows point toward sieve plates. (D) Loading of phloem with CFDA (red) shows that fine SEOR1-YFP filaments (cyan) are located within mature, translocating sieve tubes. Amorphous bodies are located outside of translocating files. (E) and (F) In older root tissue, a large amount of SEOR1-YFP is abundant in sieve tubes. Consecutive files lead into branch roots (E). Before dispersion, amorphous SEOR1-YFP bodies (arrow) are indicative of young developing sieve tubes and do not translocate CFDA (red). (G) and (H) At highest resolution, the ER (green) is surrounded by a fine SEOR1-YFP filament meshwork (cyan). (I) SEOR1-YFP filaments cover and/or traverse a sieve plate (arrow), outlining the sieve plate pores. (J) Despite the presence of filaments (cyan) in the pores, sieve tubes are fully functional, as indicated by translocation of CFDA (red). Bars = 25 μm in (A) to (E) and (G), 75 μm in (F), and 5 μm in (H) to (J).
Figure 3.
Figure 3.
TEM of Sieve Tubes in Arabidopsis. (A) and (B) Standard chemical fixation of tissue sections of Arabidopsis shows the typical abundance of P protein filaments (dashed arrow) in front of the sieve plate ([A], solid arrow) or in the sieve plate pores (B). Remnants of sieve element plastids ([B], open arrows) can be found around the sieve plate. (C) and (D) Standard fixation of whole Arabidopsis plants resembles images after gentle preparation. Protein filaments (dashed arrows) are located in the lumen of the sieve element, but a sieve element plastid (asterisk) in front of the sieve plate (solid arrow) is intact. (E) Arabidopsis phloem tissue after plunge freezing of entire plants. Phloem parenchyma cells (PP) are completely destroyed by the freezing procedure, but sieve elements (SE) and companion cells (CC) show unprecedented preservation. Sieve element plastids (asterisk) and mitochondria (solid arrows) are well preserved. Most importantly, protein filaments (dashed arrows) are not randomly located in the lumen but consist of longitudinally aligned filaments at the margins of the cells. Bars = 1000 nm in (A), (B), and (E) and 500 nm in (C) and (D).
Figure 4.
Figure 4.
Fine Structure of Arabidopsis Sieve Tubes. (A) Cross section of an Arabidopsis vascular bundle showing two sieve elements. Large bundles of filaments (solid arrows) are located at the margins of the cells. Filaments and sieve element plastids (dashed arrow) fill a significant portion of the tube lumen. (B) and (C) Tangential section through the marginal layer of a sieve element showing aligned filaments in a bundle (B). While the filaments are usually aligned in parallel to the sieve elements’ (SE) long axis, they appear flexible and may bend backward (C). (D) Sieve plate pores are unobstructed and do not contain any detectable callose. (E) Cross section of a sieve element (SE) showing stacked ER cisternae. The ER is usually not as well preserved as in standard fixed tissue. It appears to descend into a less defined amorphous ground matrix. (F) A sieve element plastid with a smooth surface in direct contact with sieve tube sap. (G) A cross section through a sieve element showing a variety of sieve tube components, such as mitochondria, P protein filaments (solid arrow), ER (open arrow), and electron-dense vesicles (dashed arrow) embedded in an amorphous ground matrix. (H) Two mitochondria (asterisks) covered by a halo of proteins (dashed arrow) that attach them to protein filaments (solid arrow). (I) In other cases, mitochondria (asterisk) are surrounded by membranes from which electron-dense vesicles (solid arrows) may bud off. Again, membranes are not in direct contact with the mitochondria but are attached by small proteins (dashed arrows). The electron-dense vesicles and mitochondria are usually embedded in the amorphous ground matrix (open arrow), while P protein filaments and sieve element plastids are always in contact with sieve tube sap. Bars = 1000 nm in (A), 500 nm in (B) to (E), (G), and (I), and 250 nm in (F) and (H).
Figure 5.
Figure 5.
SEOR1 Mutant-DNA Insertion Line. (A) A representation of the Arabidopsis gene At3g01680 indicating the location of the T-DNA insertion in the GABI-KAT 609F04 line and the location of a possible weak promoter indicated by analysis using PlantpromoterDB 2.0 (http://ppdb.agr.gifu-u.ac.jp/ppdb/cgi-bin/index.cgi). Also shown are three sections amplified by RT-PCR showing that a truncated mRNA product containing sections 2 and 3 is produced in the T-DNA insertion mutant. C, amplification control; KO, GABI-KAT 609f04; WT, wild-type Arabidopsis line Columbia. (B) Immunolocalization using a P protein–specific antibody indicates P proteins are absent in GABI-KAT 609F04 (insets are higher magnification images of single vascular bundles), and RT-PCR analysis shows the expression of the adjacent gene At3g01670 (70) is unaffected in the At3G01680 (80) T-DNA insertion mutant (Actin serves as an amplification control). (C) TEM micrograph of SEOR1 T-DNA insertion mutant after standard chemical fixation. Filaments filling the lumen of the sieve tube as shown in Figure 3 are absent. (D) and (E) TEM micrographs of At SEOR1 T-DNA insertion mutant after freeze substitution of whole plants. At SEOR1 filaments are absent, but all other structures, such as ER, mitochondria, and clamps proteins surrounding the mitochondria, are present. (F) Transformation of KO:GABI-KAT 609f04 with At SEOR1-GFP leads to filament formation. Bars = 100 μm in (B) (inset = 20 μm), 1 μm in (C), 500 nm in (D) and (E), and 3 μm in (F).
Figure 6.
Figure 6.
Obstructions in Arabidopsis Sieve Tubes. (A) to (D) Protein agglomerations (cyan) in the lumen of sieve tubes are variable. In many sieve elements, filaments are located at the margins of the cells. (A) The presence of filaments on the sieve plate (arrow) outlines their location. (B) A larger agglomeration of P protein (dashed arrows) on both sides of a sieve plate (solid arrow). The P protein agglomerations fray out into filaments. Some of the filaments connect through the sieve plate. (C) and (D) Overview images of CFDA (red) translocating sieve tubes containing massive P protein agglomerations. Sieve plates (solid arrows) are often not directly covered with P protein agglomerations. Some agglomerations appear to completely fill the lumen of the tube (dashed arrows), while others only cover part of it (open arrows). (E) Two P protein agglomerates. The upper agglomeration frays out into filaments. Some darker spots indicate the location of organelles, in this case most likely mitochondria. The lower agglomerate is completely amorphous. (F) The same sieve tubes as shown in (E). The upper file is fully mature and translocates CFDA (red) despite the presence of the large P protein agglomeration (dashed arrow) in front of the sieve plate (solid arrow). The lower tube is not fully mature. The amorphous P protein body (arrowhead) has not transformed into strands and is not translocating CFDA, while the next sieve element on the left in the same file is in the transition phase. (G) Three consecutive images of a FRAP experiment. The dashed arrow indicates the location of the P protein agglomeration shown in (E). The tube has been bleached by the laser and quickly refills after decrease of the laser energy indicating transport. (H) Four TEM images of a serial section of a sieve tube in the area of the sieve plate. (H1) to (H4) A cross section through the plate shows several open pores in the center, while significant portions at the margin of the plate are covered with filaments (H1). In consecutive sections (~1 μm apart from each other), filaments fill >50% of the lumen (H2) and move toward the membrane (H3) until they form discrete bundles (H4). (I) Serial section through an Arabidopsis sieve plate, oriented in a slight angle in relation to the sieve tube. (I1) and (I2) While most pores are open (I1), filaments are present on the plate (I2). (I3) Higher magnification of sieve pores in the sieve plate shown in (I2) (box). SEOR1 filaments can be seen in some pores ([I3], arrows). (I4) A few micrometers behind the plate, filaments move toward the margins. (J) Four images of a serial section through the lumen of a sieve tube containing an agglomeration. Major parts of the lumen are filled with P protein filaments, but a channel is unobstructed. The filaments are mostly oriented in parallel and have a pseudocrystalline appearance. A sieve element plastid is abundant in J4. The distance from (J1) to (J4) is 7 μm. Bars = 10 μm in (A) and (B), 25 μm in (C), (D), (F), and (G), 5 μm in (E), and 500 nm in (H) to (J).
Figure 7.
Figure 7.
SEOR1-Like Filaments in Tobacco and Black Cottonwood. (A) A cross section through a tobacco sieve element (SE) shows several sieve element (SE) plastids covered with Arabidopsis SEOR1 filaments and bundles. (B) A tangential section through an Arabidopsis sieve element along the organelle containing layer close to the plasma membrane. A large SEOR1 bundle of multiple filaments covers the membrane. (C) Longitudinal section through a black cottonwood sieve tube. The preservation is not as good as in Arabidopsis and tobacco, but Arabidopsis SEOR1-like filaments are visible. Bars = 1000 nm (A) and (B) and 150 nm in (C).
Figure 8.
Figure 8.
Schematic Reconstruction of an Arabidopsis Sieve Tube. Reconstruction of the structure of a sieve element-companion cell complex as found in in vivo confocal studies and after freeze substitution of whole plants. Sieve elements contain ER, mitochondria covered with clamp proteins, and electron-dense vesicles. While those structures are usually embedded in an amorphous ground matrix, SEOR1 filaments and sieve element plastids are always in direct contact with the sieve tube sap. A SEOR1 agglomeration is shown in front of a plate that does not fill the entire lumen of the sieve element. Companion cells contain all organelles typical for a plant cell, but only nucleus, vacuoles, chloroplasts, and mitochondria are shown. Blue lines indicate the location of a cross section for (A) to (C). C, chloroplast; Cl, clamp proteins; EV, electron-dense vesicles; GM, ground matrix; M, mitochondria; N, nucleus; P, plastid; SR, SEOR1 filaments; V, vacuole.
Figure 9.
Figure 9.
In Vivo Flow and Injury Experiments. (A) and (B) Comparison of phloem flow velocities along a main root of the Arabidopsis wild type (A) and SEOR1 T-DNA insertion mutant (B). The entire root system is visible in MicroROCs after loading with CFDA, permitting flow measurements in individual tubes by FRAP. No significant difference was found between mutant and wild-type plants. (C) and (D) FRAP experiment on an individual tube. Three frames from Supplemental Movie 2 online (C). After bleaching of CFDA, the laser intensity was lowered and refilling of the tube was monitored at subsecond intervals. Regions of interest are marked along the tube (arrows and colors of arrows correspond to colors in graph), and fluorescence intensity is measured and graphed (D), giving a direct reading of flow velocity in the tube. (E) and (E1) to (E4) Four frames of Supplemental Movie 3 online, showing the slow movement (flow is right to left) of SEOR1-YFP filaments through a sieve plate (arrow). Movement does not stop even after 23 min. Bars = 5 mm in (A) and (B), 100 μm in (C), and 10 μm in (E).

Similar articles

Cited by

References

    1. Bánó M., Marek J. (2006). How thick is the layer of thermal volume surrounding the protein? Biophys. Chem. 120: 44–54 - PubMed
    1. Becker D., Kemper E., Schell J., Masterson R. (1992). New plant binary vectors with selectable markers located proximal to the left T-DNA border. Plant Mol. Biol. 20: 1195–1197 - PubMed
    1. Beneteau J., Renard D., Marché L., Douville E., Lavenant L., Rahbé Y., Dupont D., Vilaine F., Dinant S. (2010). Binding properties of the N-acetylglucosamine and high-mannose N-glycan PP2-A1 phloem lectin in Arabidopsis. Plant Physiol. 153: 1345–1361 - PMC - PubMed
    1. Bostwick D.E., Dannenhoffer J.M., Skaggs M.I., Lister R.M., Larkins B.A., Thompson G.A. (1992). Pumpkin phloem lectin genes are specifically expressed in companion cells. Plant Cell 4: 1539–1548 - PMC - PubMed
    1. Bozzola J.J., Russell L.D. (1999). Electron Microscopy: Principles and Techniques for Biologists. (Sudbury, MA: Jones & Bartlett Learning)

Publication types

MeSH terms