

A theory for water and macromolecular transport in the pulmonary artery wall with a detailed comparison to the aorta
- PMID: 22198178
- PMCID: PMC3330798
- DOI: 10.1152/ajpheart.00447.2011
A theory for water and macromolecular transport in the pulmonary artery wall with a detailed comparison to the aorta
Abstract
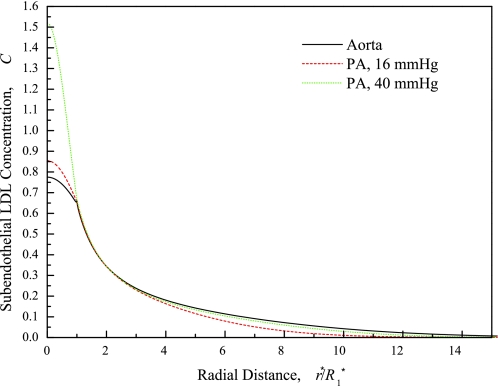
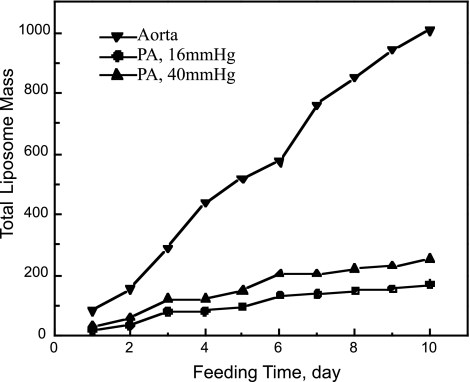
The pulmonary artery (PA) wall, which has much higher hydraulic conductivity and albumin void space and approximately one-sixth the normal transmural pressure of systemic arteries (e.g, aorta, carotid arteries), is rarely atherosclerotic, except under pulmonary hypertension. This study constructs a detailed, two-dimensional, wall-structure-based filtration and macromolecular transport model for the PA to investigate differences in prelesion transport processes between the disease-susceptible aorta and the relatively resistant PA. The PA and aorta models are similar in wall structure, but very different in parameter values, many of which have been measured (and therefore modified) since the original aorta model of Huang et al. (23). Both PA and aortic model simulations fit experimental data on transwall LDL concentration profiles and on the growth of isolated endothelial (horseradish peroxidase) tracer spots with circulation time very well. They reveal that lipid entering the aorta attains a much higher intima than media concentration but distributes better between these regions in the PA than aorta and that tracer in both regions contributes to observed tracer spots. Solutions show why both the overall transmural water flow and spot growth rates are similar in these vessels despite very different material transport parameters. Since early lipid accumulation occurs in the subendothelial intima and since (matrix binding) reaction kinetics depend on reactant concentrations, the lower intima lipid concentrations in the PA vs. aorta likely lead to slower accumulation of bound lipid in the PA. These findings may be relevant to understanding the different atherosusceptibilities of these vessels.
Figures


Similar articles
-
Aquaporin-1 facilitates pressure-driven water flow across the aortic endothelium.Am J Physiol Heart Circ Physiol. 2015 May 1;308(9):H1051-64. doi: 10.1152/ajpheart.00499.2014. Epub 2015 Feb 6. Am J Physiol Heart Circ Physiol. 2015. PMID: 25659484 Free PMC article.
-
Transport in rat vessel walls. II. Macromolecular leakage and focal spot size growth in rat arteries and veins.Am J Physiol Heart Circ Physiol. 2007 Jun;292(6):H2881-90. doi: 10.1152/ajpheart.00575.2006. Epub 2007 Jan 5. Am J Physiol Heart Circ Physiol. 2007. PMID: 17209003
-
Transport in rat vessel walls. I. Hydraulic conductivities of the aorta, pulmonary artery, and inferior vena cava with intact and denuded endothelia.Am J Physiol Heart Circ Physiol. 2006 Dec;291(6):H2758-71. doi: 10.1152/ajpheart.00610.2005. Epub 2006 May 26. Am J Physiol Heart Circ Physiol. 2006. PMID: 16731638
-
Risk factors, endothelial cell turnover and lipid transport in atherogenesis.Zhonghua Yi Xue Za Zhi (Taipei). 1996 Nov;58(5):309-16. Zhonghua Yi Xue Za Zhi (Taipei). 1996. PMID: 9037845 Review.
-
Structural pathways for macromolecular and cellular transport across the blood-brain barrier during inflammatory conditions. Review.Histol Histopathol. 2004 Apr;19(2):535-64. doi: 10.14670/HH-19.535. Histol Histopathol. 2004. PMID: 15024715 Review.
Cited by
-
Pre-atherosclerotic flow and oncotically active solute transport across the arterial endothelium.J Theor Biol. 2020 Aug 21;499:110275. doi: 10.1016/j.jtbi.2020.110275. Epub 2020 Apr 8. J Theor Biol. 2020. PMID: 32275985 Free PMC article.
-
Aquaporin-1 shifts the critical transmural pressure to compress the aortic intima and change transmural flow: theory and implications.Am J Physiol Heart Circ Physiol. 2015 Dec 1;309(11):H1974-86. doi: 10.1152/ajpheart.00316.2015. Epub 2015 Sep 4. Am J Physiol Heart Circ Physiol. 2015. PMID: 26342066 Free PMC article.
-
Aquaporin-1 facilitates pressure-driven water flow across the aortic endothelium.Am J Physiol Heart Circ Physiol. 2015 May 1;308(9):H1051-64. doi: 10.1152/ajpheart.00499.2014. Epub 2015 Feb 6. Am J Physiol Heart Circ Physiol. 2015. PMID: 25659484 Free PMC article.
References
-
- Batchelor GK. An Introduction to Fluid Mechanics. Cambridge, MA: Cambridge University Press, 1967
-
- Berenson GS, Radhakrishnamurthy B, Srinivasan SR, Vijayagopal P, Dalferes ER. Proteoglycans and potential mechanisms related to atherosclerosis. Ann NY Acad Sci 454: 69–78, 1985 - PubMed
-
- Bird RBB, Stewart WE, Lightfoot EN. Transport Phenomena. New York: John Wiley & Sons, 2002
-
- Cardoso LE, Mourao PA. Glycosaminoglycan fractions from human arteries presenting diverse susceptibilities to atherosclerosis have different binding affinities to plasma LDL. Arterioscler Thromb 14: 115–124, 1994 - PubMed
-
- Chan KL. Is aortic stenosis a preventable disease? J Am Coll Cardiol 42: 593–599, 2003 - PubMed
Publication types
MeSH terms
Substances
Grants and funding
LinkOut - more resources
Full Text Sources