. 2012 Mar;15(1):87-98.
doi: 10.1007/s10456-011-9245-x. Epub 2011 Dec 24.

In vivo laser speckle imaging reveals microvascular remodeling and hemodynamic changes during wound healing angiogenesis

Affiliations

In vivo laser speckle imaging reveals microvascular remodeling and hemodynamic changes during wound healing angiogenesis

Abhishek Rege et al. Angiogenesis. 2012 Mar.

Abstract

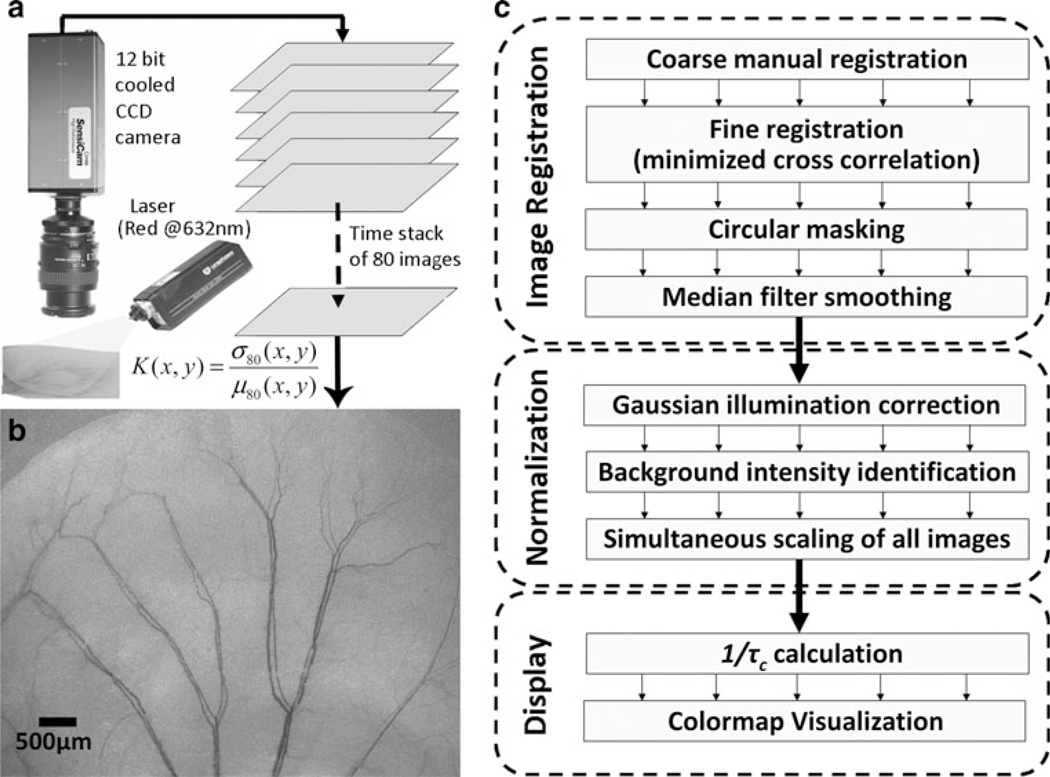
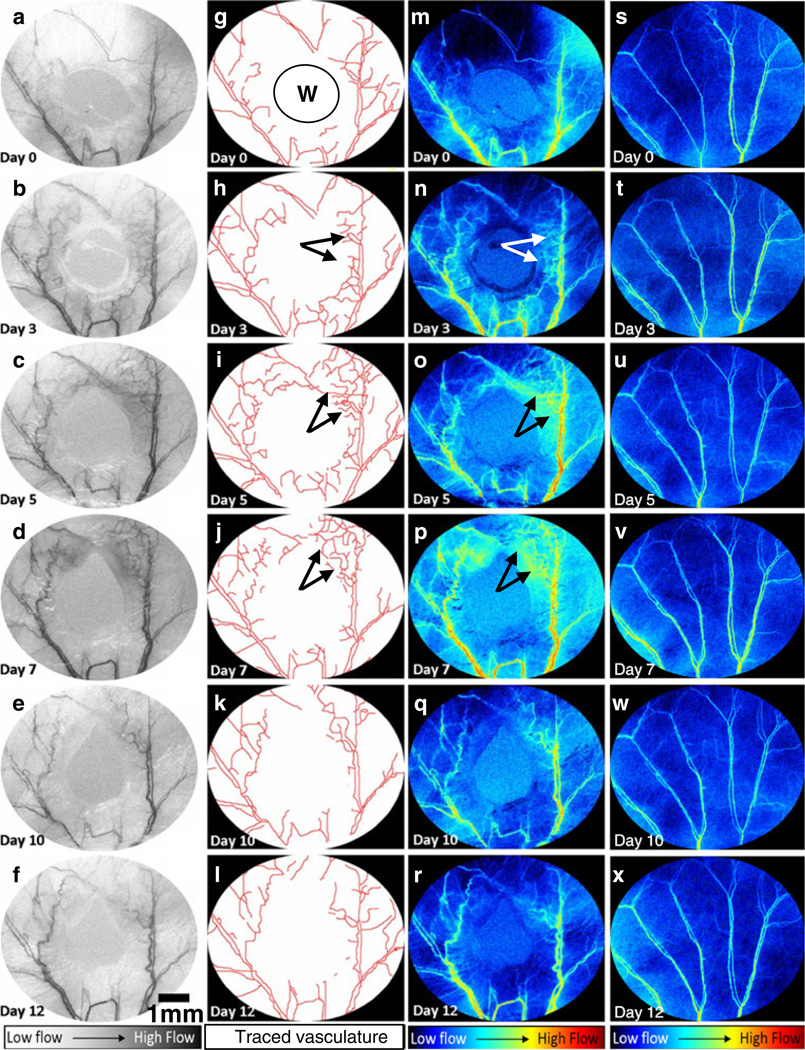
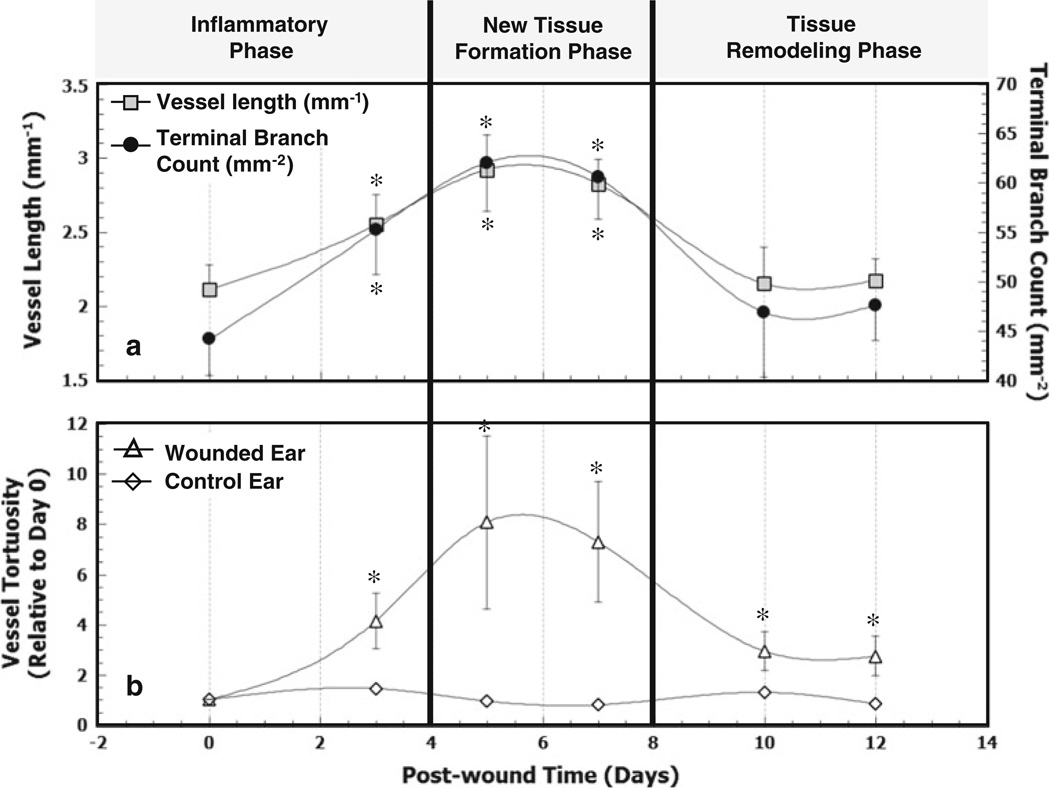
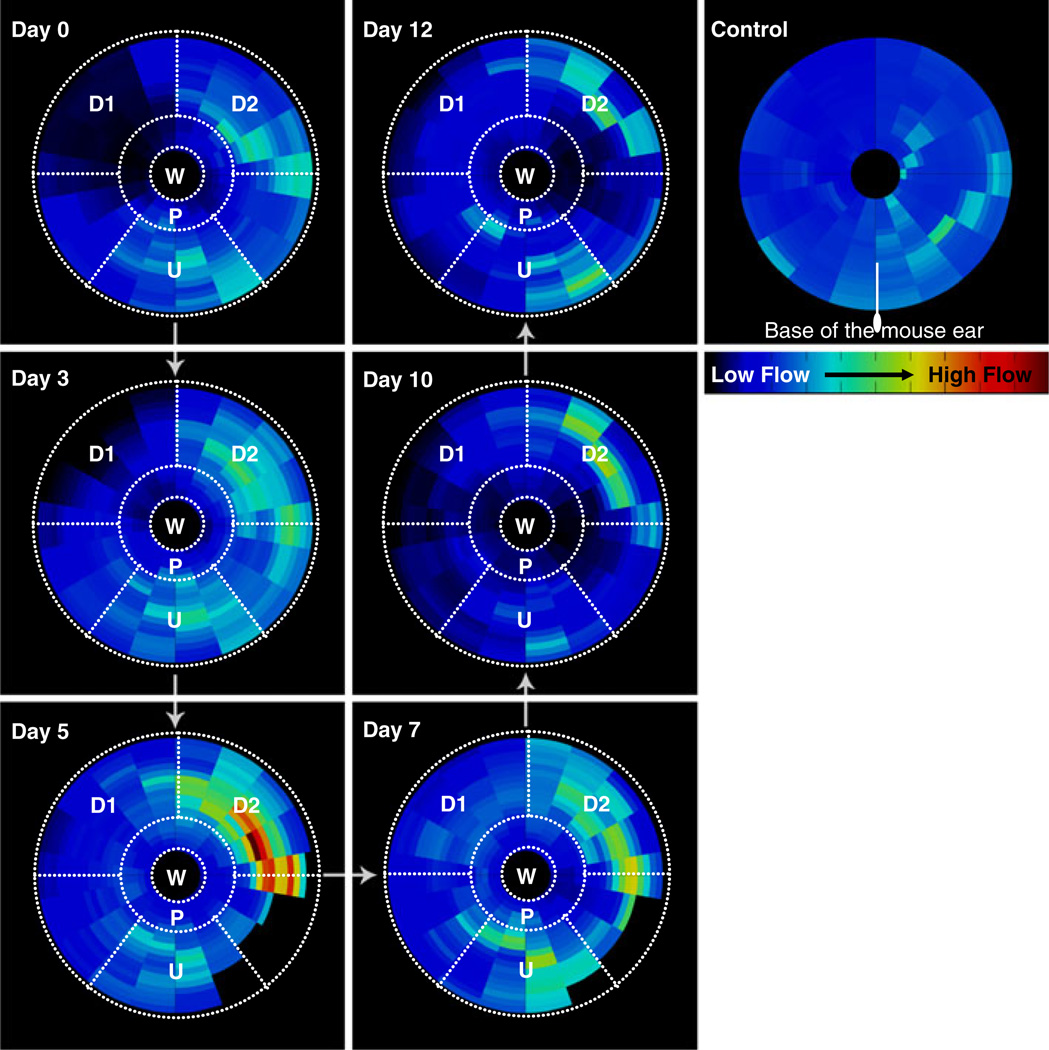
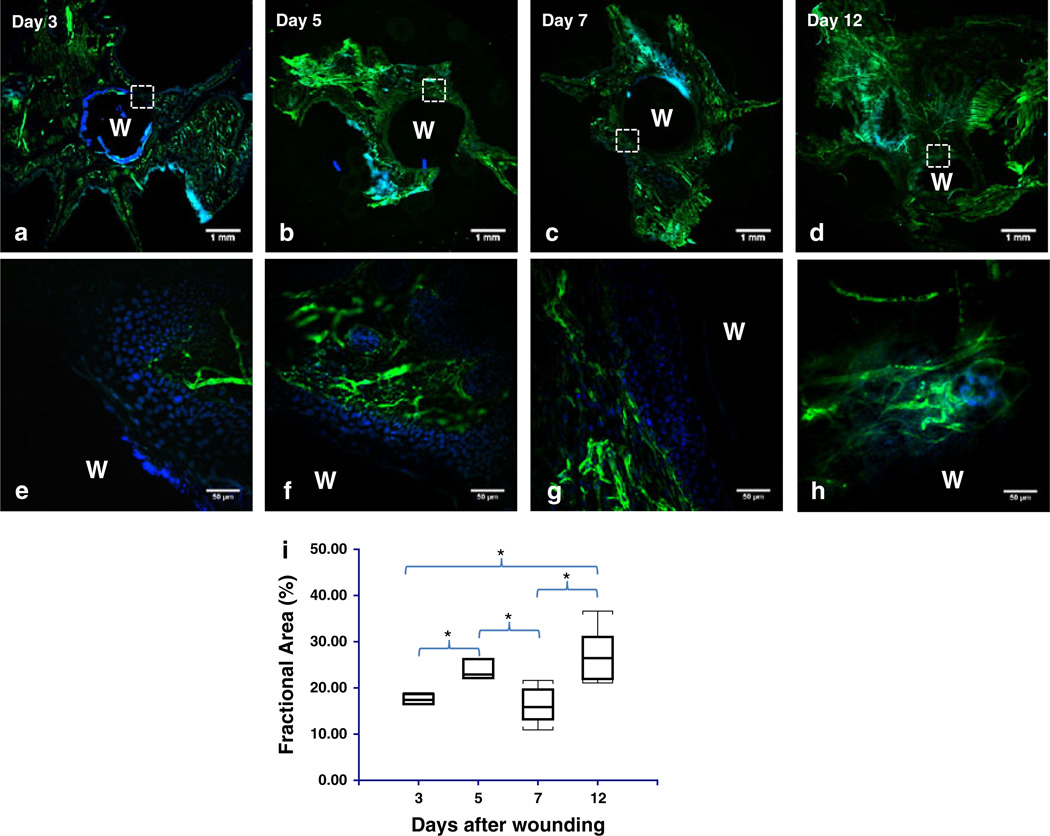
Laser speckle contrast imaging (LSCI) is a high-resolution and high contrast optical imaging technique often used to characterize hemodynamic changes in short-term physiological experiments. In this study, we demonstrate the utility of LSCI for characterizing microvascular remodeling and hemodynamic changes during wound healing angiogenesis in vivo. A 2 mm diameter hole was made in the mouse ear and the periphery of the wound imaged in vivo using LSCI over 12 days. We were able to visualize and quantify the vascular and perfusion changes that accompanied wound healing in the microenvironment proximal to the wound, and validated these changes with histology. We found that consistent with the stages of wound healing, microvessel density increased during the initial inflammatory phase (i.e., day 0-3), stayed elevated through the tissue formation phase (i.e., until day 7) and returned to baseline during the tissue remodeling phase (i.e., by day 12). Concomitant "wide area mapping" of blood flow revealed that tissue perfusion in the wound periphery initially decreased, gradually increased from day 3-7, and subsided as healing completed. Interestingly, some regions exhibited a reestablishment of tissue perfusion approximately 6 days earlier than the ~18 days usually reported for the long term remodeling phase. The results from this study demonstrate that LSCI is an ideal platform for elucidating in vivo changes in microvascular hemodynamics and angiogenesis, and has the potential to offer invaluable insights in a range of disease models involving abnormal hemodynamics, such as diabetes and tumors.


Figures

Fig. 1
Fig. 1
LSCI technique for longitudinal imaging of mouse ear vasculature: a LSCI consists of acquisition of a time stack of 80 images of the immobilized mouse ear using a 12 bit cooled CCD camera and its subsequent processing using the temporal speckle contrast equation to obtain a high resolution and high contrast, yet wide field image of the mouse ear vasculature. b An example image of the mouse ear vasculature obtained using LSCI. Note that the field of view is 6.4 mm × 4.8 mm with the smallest vessel visible having a diameter of 20 µm (3 pixels). c The post-processing steps required to monitor angiogenic response over the course of multiple imaging sessions through the wound healing period. Each image is first registered to the baseline and the intensity values are normalized to compare flow over multiple images. Finally, the images are color-coded for improved visualization of tissue blood flow
Fig. 2
Fig. 2
In vivo angiogenic response during wound healing using LSCI in a mouse ear model: The first column (a–f) shows representative sequential LSCI images acquired on days 0, 3, 5, 7, 10 and 12 after wound creation (indicated by W). The outlines of these vessels were manually segmented as shown in the second column (g–l). The third column (m–r) shows the changes in blood flow (1/τc values) that occur during the wound healing period. For comparison, the fourth column (s–x) shows changes in blood flow (1/τc values) over the same period in a control mouse ear. These color mapped images were obtained using the procedure described in Fig. 1c. Regions indicated by arrows exhibited an increase in neovascularization and average flow until day 7, which then subsided as healing completed
Fig. 3
Fig. 3
In vivo changes in vascular morphology during wound healing: The vascular response was monitored using LSCI on days 0, 3, 5, 7, 10 and 12 after wound creation. Blood vessels were manually traced and both, vessel length as well as the number of terminal vessel branches were counted to quantify the degree of neovascularization. a Longitudinal trends in vessel length and TB count calculated per unit area (mm2) of healing skin in the wound periphery. Asterisks indicate that vessel lengths and terminal branch counts for days 3, 5, and 7 were significantly different from those on day 0. b Changes in tortuosity of parent feeding blood vessel during wound healing. The plot shows the mean tortuosity over the 12 day course of wound healing. The tortuosity of the unwounded controls did not vary significantly. Asterisks indicate that vessel tortuosity in the wounded ear was significantly greater than that in the control ear on days 3 (P = 0.02), 5 (P = 0.05), 7 (P = 0.03), 10 (P = 0.08) and 12 (P = 0.06)
Fig. 4
Fig. 4
Spatiotemporal analysis of in vivo blood flow changes in the wound periphery: This circular plot illustrates the mean blood flow (computed from all mice in the cohort) in the wound periphery as a function of its orientation with respect to the wound and the base of the ear. The wound is represented on all plots as a circle of fixed diameter and each concentric region around it represents a 50 µm wide region. The radial distance on each plot is the shortest distance of that region from the wound outline, and is analyzed in increments of 50 µm. Similarly, the angle (0° < θ < 360°) on the plots is the angle that a line joining the region with the wound center subtends with the line joining the base of the ear with wound center in the counter clockwise direction. Salient observations were made in each of the following ROIs—W: wound, P: proximal region, U: upstream region, D1: downstream region 1, D2: downstream region 2
Fig. 5
Fig. 5
Histological validation of vascular remodeling during wound healing: a–d Representative low magnification (2×) images of sections from the flattened mouse ear pinna in which the blood vessel endothelia are labeled with laminin (green) and nuclei with DAPI (blue). The wound is indicated by ‘W’ in all panels. e–g High magnification (40×) images of the region indicated by the hatched square in (a–d). The wound granulation layer starts out as avascular (e), obtains some peripheral vascularization (f), followed by additional peripheral vascularization (g), and finally becomes well vascularized (h). i Box and whisker plot of the fractional area of laminin staining at days 3, 5, 7 and 12. The fractional area was a significantly elevated at days 5 and 7 relative to day 3 and at days 5 and 12 relative to day 7

References

    1. Singer AJ, Clark RAF. Cutaneous wound healing. New Eng J Med. 1999;341:738–746. - PubMed
    1. Kiyama T, Naito M, Shitama H, Shinoda T, Maeyama A. Comparison of skin blood flow between mini- and standard-incision approaches during total hip arthroplasty. J Arthroplast. 2008;23:1045–1049. - PubMed
    1. Koskela M, Gaddnas F, Ala-Kokko TI, Laurila JJ, Saarnio J, et al. Epidermal wound healing in severe sepsis and septic shock in humans. Crit Care. 2009;13:R100. - PMC - PubMed
    1. Ngo BT, Hayes KD, DiMiao DJ, Srinivasan SK, Huerter CJ, et al. Manifestations of cutaneous diabetic microangiopathy. Am J Clin Dermatol. 2005;6:225–237. - PubMed
    1. Chung JH, Eun HC. Angiogenesis in skin aging and photoaging. J Dermatol. 2007;34:593–600. - PubMed

Publication types

LinkOut - more resources