Review
. 2012 Mar 15;519(2):81-90.
doi: 10.1016/j.abb.2011.10.024. Epub 2011 Dec 16.

Allostery and cooperativity in Escherichia coli aspartate transcarbamoylase

Affiliations
Review

Allostery and cooperativity in Escherichia coli aspartate transcarbamoylase

Evan R Kantrowitz. Arch Biochem Biophys. .

Abstract

The allosteric enzyme aspartate transcarbamoylase (ATCase) from Escherichia coli has been the subject of investigations for approximately 50 years. This enzyme controls the rate of pyrimidine nucleotide biosynthesis by feedback inhibition, and helps to balance the pyrimidine and purine pools by competitive allosteric activation by ATP. The catalytic and regulatory components of the dodecameric enzyme can be separated and studied independently. Many of the properties of the enzyme follow the Monod, Wyman Changeux model of allosteric control thus E. coli ATCase has become the textbook example. This review will highlight kinetic, biophysical, and structural studies which have provided a molecular level understanding of how the allosteric nature of this enzyme regulates pyrimidine nucleotide biosynthesis.


Figures

Fig. 1
Fig. 1
Aspartate transcarbamoylase catalyzes the reaction between carbamoyl phosphate (CP) and L-aspartate to form N-carbamoyl-L-aspartate (CA) and inorganic phosphate (Pi). Presumably, the reaction proceeds via a tetrahedral intermediate. The bisubstrate analog N-phosphonacetyl-L-aspartate (PALA), possessing many of the binding loci of the tetrahedral intermediate, is a potent inhibitor of the enzyme.
Fig. 2
Fig. 2
Aspartate saturation curves of ATCase in the absence of allosteric effectors (circles), in the presence of 4 mM ATP (squares) and in the presence of 2 mM CTP (triangles). The reactions were performed at 25°C in 0.05 M Tris-acetate buffer pH 8.3. At this pH substrate inhibition is observed at high concentrations of Asp.
Fig. 3
Fig. 3
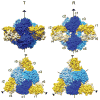
Quaternary structure of ATCase in the T (left) and R (right) states with the molecular 3-fold axis vertical (top) and viewed down the molecular 3-fold axis (bottom). The molecule expands 11Å along the 3-fold axis during the allosteric transition. During the T to R transition the regulatory dimers rotate ±6° around their respective 2-fold axes and the catalytic trimer rotate ±7.5° around the 3-fold axis. The catalytic chains are shown in shades of blue and the regulatory chains are shown in yellow and tan.
Fig 4
Fig 4
The secondary structure of one catalytic and one regulatory chain of E. coli ATCase in the R-state. In the regulatory chain the β-sheets are shown in blue and the α-helices in maroon, while in the catalytic chain the β-sheets are shown in maroon and the α-helices in blue. The N- and C-termini of the catalytic and regulatory chains are indicated, as well as the Zn atom in the regulatory chain that is coordinated tetrahydrally to four cysteine residues. Each catalytic chain is composed of an aspartate (Asp) and a carbamoyl phosphate (CP) domain. Each regulatory chain is composed of an allosteric (Al) and a zinc (Zn) domain. CTP is shown as spheres bound to the allosteric site (Al site) in the regulatory chain, and phosphonacetamide and succinate, analogs of CP and Asp, respectively) are shown as spheres bound in the active site of the catalytic chain. This figure was drawn with PyMol [83] using data from PDB entry 8AT1 [84].
Fig. 5
Fig. 5
Structural changes of the α-carbon backbone associated with the binding of PALA to the unligated ATCase. Structure of one catalytic chain of E. coli ATCase along with the 80’s loop from the adjacent chain (80’s, c2). The structure of the unliganded enzyme is shown with blue highlights, while the structure of the ATCase•PALA complex is shown with red highlights, PALA is represented as spheres, and active site residues as sticks. The color gradient corresponds to 40 structures calculated linearly between the two determined X-ray structures, PDB entries 1ZA1 [74] and 1D09 [35].
Fig. 6
Fig. 6
Stereoview of the allosteric site of ATCase in the T state. Superposition of the B chain of the ATCase structures with the allosteric inhibitor CTP (PDB entry 5AT1, green) and the allosteric activator ATP (PDB entry 4AT1, magenta) bound [80]. Interactions involving residues Val9, Ile12 and Tyr89 are from the protein backbone. Not shown are non-polar interactions with Ala11 and Ile86 with CTP and Glu10 and Ala11 with ATP. This figure was drawn using Molscript [85].
Fig. 7
Fig. 7
Surface representation of the allosteric site of ATCase colored by the atoms of the residues which interact with the allosteric effectors CTP and ATP (red, blue and white) showing changes in the surface upon the binding of the allosteric effectors. The binding of CTP (A) or ATP (B) causes the conformational changes from the unliganded surface (mesh) to the allosteric effector bound surface (solid). (C) The ATP-bound surface (mesh) changes to the solid surface when CTP binds. (D) The CTP bound surface (mesh) changes to the solid surface when ATP binds. This figure was drawn using the PDB entries 6AT1 (unliganded), 5AT1 (CTP bound) and 4AT1 (ATP bound) [80] using Chimera [86].
Fig. 8
Fig. 8
A schematic representation of the interactions that have been identified as important for the allosteric transition in ATCase by site-specific mutagenesis in the T (A) and R (B) states. For clarity, only one catalytic chain from each of the upper (c1) and lower (c4) catalytic subunits is shown. Because of the molecular 3-fold axis, the various interactions shown here are repeated in the c2/c5, and c3/c6 pairs. In the T state stabilizing interactions exist between the c1 and c4 catalytic chains, and between the c1 catalytic and the r1 regulatory chains. The 240’s loops of c1 and c4 undergo a large alteration in position and change from being side by side in the T state to almost one on top of the other in the R state. In the R state, the interchain interactions between c1 and c4 and between c1 and r4 are lost. All of the interactions indicated have been shown experimentally to stabilize the T or R states of the enzyme. Interactions between chains not involved in allosteric-state stabilization are not shown.
Fig. 9
Fig. 9
Scattering curves for the reconstituted ATCase holoenzymes, (A) all six catalytic chains are wild-type (yellow), (B) all six catalytic chains are mutant unable to bind PALA (purple), and (C) a hybrid with only one catalytic chain capable of binding PALA. All holoenzyme species were at a final concentration of 37 mg/ml. Scattering was performed at 25 °C in 40 mM KH2PO4 buffer, pH 7.0 in the absence (●) and presence (○) of 1 mM PALA. The scattering curves are expressed as the scattering vector s (s = (2 sin θ/λ), where 2θ and λ are the scattering angle and the wavelength of the X-ray beam, respectively) [65].
Fig. 10
Fig. 10
Time evolution of the ATCase structural change at 5°C as determined by time-resolved SAXS. Individual scattering patterns were recorded at 17 millisecond intervals. Scattering intensities were integrated over the s range 0.012–0.024 Å−1 and plotted as a function of time. The integrated intensity of the T-state was normalized to zero. The reaction can be divided into three phases. The initial transition from the T to the R state is observed upon with mixing of Asp with the ATCase•CP complex at time zero (red). The steady-state structural phase (green) is observed when the majority of the enzyme population is in the R state and substrates are in excess, and the relaxation phase (blue) is observed when the enzyme population is shifting back to the T state as substrates are exhausted.

References

    1. Yates RA, Pardee AB. J Biol Chem. 1956;221:757–770. - PubMed
    1. Jones ME, Spector L, Lipmann F. J Am Chem Soc. 1955;77:819–820.
    1. Lowenstein JM, Cohen PP. J Biol Chem. 1956;235:57–78. - PubMed
    1. Reichard P, Hanshoff G. Acta Chem Scand. 1956;10:548–560.
    1. Shepherdson M, Pardee AB. J Biol Chem. 1960;235:3233–3237.

Publication types

MeSH terms

Substances

LinkOut - more resources