. 2012 Mar;217(2):209-21.
doi: 10.1007/s00221-011-2987-2. Epub 2011 Dec 24.

Analysis of motoneuron responses to composite synaptic volleys (computer simulation study)

Affiliations

Analysis of motoneuron responses to composite synaptic volleys (computer simulation study)

Maria Piotrkiewicz et al. Exp Brain Res. 2012 Mar.

Abstract

This paper deals with the analysis of changes in motoneuron (MN) firing evoked by repetitively applied stimuli aimed toward extracting information about the underlying synaptic volleys. Spike trains were obtained from computer simulations based on a threshold-crossing model of tonically firing MN, subjected to stimulation producing postsynaptic potentials (PSPs) of various parameters. These trains were analyzed as experimental results, using the output measures that were previously shown to be most effective for this purpose: peristimulus time histogram, raster plot and peristimulus time intervalgram. The analysis started from the effects of single excitatory and inhibitory PSPs (EPSPs and IPSPs). The conclusions drawn from this analysis allowed the explanation of the results of more complex synaptic volleys, i.e., combinations of EPSPs and IPSPs, and the formulation of directions for decoding the results of human neurophysiological experiments in which the responses of tonically firing MNs to nerve stimulation are analyzed.


Figures

Fig. 1
Fig. 1
Principles of the modeling. Traces from bottom to top: AHP curve, interspike membrane potential trajectory, firing threshold time course, tonic synaptic inflow. Broken lines: at 0, asymptotic threshold level; at −10, resting membrane potential AA, AHP amplitude. Note that all traces are interrupted by spike generation (1, 2, 3, 4, 5, 6) and reset afterward
Fig. 2
Fig. 2
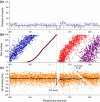
Methodology of data analysis (single EPSP, parameters in Table 2): a PSTH; solid horizontal line: mean value, broken horizontal lines: significance limits (mean ± 2.5*SD), calculated over the period of 200 ms prior to stimulus; shaded represent the areas of peak and trough, from which firing indexes (FIs) are calculated; b raster plot; −1 (circles): background discharges, 0 (crosses): discharges that begin the target intervals, 1 (diamonds): discharges that terminate target intervals: 2 (asterisks) and 3 (triangles): next regular discharges; c PSTI; open circles: ISIs (note that in Figs. 2, 3, 4, 5 the ordinate scale of PSTI is inverted); black circles: mean intervals calculated from 50 consecutive values; solid horizontal line: mean prestimulus ISI duration; arrows indicate PSP profile (its amplitude is adjusted individually for each figure) and secondary cluster, containing discharges that terminate target intervals. Vertical dotted lines contain the response to the EPSP. This figure was compiled from 800 tests
Fig. 3
Fig. 3
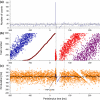
Simulation results for the single IPSP (amplitude −2 mV): a PSTH; b raster plot; c PSTI; IPSP profile indicated by an arrow. Vertical broken lines mark limits of the primary trough and indicate the next maximum, corresponding to the end of IPSP. Other symbols as in Fig. 2. Figures 3, 4, 5 were compiled from 1,000 tests
Fig. 4
Fig. 4
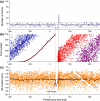
Simulation results for EPSP (amplitude 1.4 mV) followed after 6 ms by IPSP (amplitude −2 mV): a PSTH; b raster plot; c PSTI: PSP profile indicated by an arrow. Vertical broken lines mark limits of the primary peak and indicate the next maximum. Other symbols as in Fig. 2
Fig. 5
Fig. 5
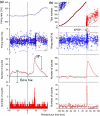
Simulation results for IPSP (amplitude −2 mV) followed after 13 ms by EPSP (amplitude 1.4 mV): a PSTH; b raster plot; c PSTI: PSP profile indicated by an arrow. Vertical broken lines mark limits of the trough and indicate the next maximum. Other symbols as in Fig. 2
Fig. 6
Fig. 6
Schematic representation of the interaction of single PSPs with interspike membrane potential trajectories (IMPT) of a model MN in target interval: a EPSP, responses synchronized with EPSP arrival; b IPSP, discharges terminating prolonged ISIs synchronized with IPSP end. For each type of stimulation, only two cases are shown, with little change (upper panels) and big change (lower panels) in the ISI duration. Thr, threshold; the lines above the threshold, schematic representation of MN spikes; broken IMPT fragments and spikes show what would have happened if the MN had not responded to the synaptic volley; dotted profiles, EPSP fragments extinguished due to spike generation
Fig. 7
Fig. 7
Comparison of PSTFs from the experiment and computer simulation: a the experimental results showing ‘Ia-only’ response of a tibialis anterior MU to nerve stimulation (adapted from Fig. 2 of Prasartwuth et al. , with kind permission of the author and Springer Science+Business Media); b simulation results (EPSP with latency 41 ms; time parameters given in Table 2). The panels from bottom to top: PSTH, PSTH CUSUM, PSTF; uppermost panels: a PSTF CUSUM, b raster plot. In a, SP, silent period; in PSTFs (a, b) and raster plot (b) indicated are areas (L) with limited number of longer ISIs; in b dotted vertical lines indicate response range

Similar articles

Cited by

  • Human stretch reflex pathways reexamined.
    Yavuz SU, Mrachacz-Kersting N, Sebik O, Berna Ünver M, Farina D, Türker KS. Yavuz SU, et al. J Neurophysiol. 2014 Feb;111(3):602-12. doi: 10.1152/jn.00295.2013. Epub 2013 Nov 13. J Neurophysiol. 2014. PMID: 24225537 Free PMC article.
  • Are Human Digit Muscles Devoid of Recurrent Inhibition?
    Piotrkiewicz M, Młoźniak D. Piotrkiewicz M, et al. Front Cell Neurosci. 2016 Jan 11;9:507. doi: 10.3389/fncel.2015.00507. eCollection 2015. Front Cell Neurosci. 2016. PMID: 26793059 Free PMC article. No abstract available.

References

    1. Ashby P, Labelle K. Effects of extensor and flexor group I afferent volleys on the excitability of individual soleus motoneurons in man. J Neurol Neurosurg Psychiatr. 1977;40:910–919. doi: 10.1136/jnnp.40.9.910. - DOI - PMC - PubMed
    1. Ashby P, Zilm D. Characteristics of postsynaptic potentials produced in single human motoneurons by homonymous group 1 volleys. Exp Brain Res. 1982;47:41–48. - PubMed
    1. Ashby P, Zilm D. Relationship between EPSP shape and cross-correlation profile explored by computer simulation for studies on human motoneurons. Exp Brain Res. 1982;47:33–40. - PubMed
    1. Awiszus F. Continuous functions determined by spike trains of a neuron subject to stimulation. Biol Cybern. 1988;58:321–327. doi: 10.1007/BF00363941. - DOI - PubMed
    1. Awiszus F. Spike train analysis. J Neurosci Meth. 1997;74:155–166. doi: 10.1016/S0165-0270(96)02246-7. - DOI - PubMed

Publication types

LinkOut - more resources