. 2012 Mar;49(3):271-81.
doi: 10.1016/j.mcn.2011.12.001. Epub 2011 Dec 8.

Examination of mesenchymal stem cell-mediated RNAi transfer to Huntington's disease affected neuronal cells for reduction of huntingtin

Affiliations

Examination of mesenchymal stem cell-mediated RNAi transfer to Huntington's disease affected neuronal cells for reduction of huntingtin

Scott D Olson et al. Mol Cell Neurosci. 2012 Mar.

Abstract

Huntington's disease (HD) is a fatal, autosomal dominant neurodegenerative disorder caused by an expanded trinucleotide (CAG) repeat in exon 1 of the huntingtin gene (Htt). This expansion creates a toxic polyglutamine tract in the huntingtin protein (HTT). Currently, there is no treatment for either the progression or prevention of the disease. RNA interference (RNAi) technology has shown promise in transgenic mouse models of HD by reducing expression of mutant HTT and slowing disease progression. The advancement of RNAi therapies to human clinical trials is hampered by problems delivering RNAi to affected neurons in a robust and sustainable manner. Mesenchymal stem cells (MSC) have demonstrated a strong safety profile in both completed and numerous ongoing clinical trials. MSC exhibit a number of innate therapeutic effects, such as immune system modulation, homing to injury, and cytokine release into damaged microenvironments. The ability of MSC to transfer larger molecules and even organelles suggested their potential usefulness as delivery vehicles for therapeutic RNA inhibition. In a series of model systems we have found evidence that MSC can transfer RNAi targeting both reporter genes and mutant huntingtin in neural cell lines. MSC expressing shRNA antisense to GFP were found to decrease expression of GFP in SH-SY5Y cells after co-culture when assayed by flow cytometry. Additionally MSC expressing shRNA antisense to HTT were able to decrease levels of mutant HTT expressed in both U87 and SH-SY5Y target cells when assayed by Western blot and densitometry. These results are encouraging for expanding the therapeutic abilities of both RNAi and MSC for future treatments of Huntington's disease.


Figures

Fig. 1
Fig. 1
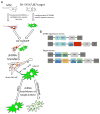
Overview of co-culture system and vectors. A. MSC and U87 or SH-SY5Y cells were transduced to express shRNAs with a dsRed reporter or HTT142 with a GFP reporter respectively. The cell populations were then co-cultured, allowing the RNAi to transfer from the MSC to the other cell by either direct cell to cell contact or indirect contact, where the shRNA subsequently reduces protein expression. B. The shRNA expression and target vectors are shown here with viral elements colored dark gray, shRNA expression elements light blue, constitutive promoters dark blue, fluorescent markers green and red, HTT142 yellow, and WPRE light gray.
Fig. 2
Fig. 2
MSC characterization. A. MSC from donor 2628 were transduced with shSCRAM or shHTT at an MOI of 80 and expanded. Representative transduced and wild type cultures at passage 4 were then analyzed for proliferation using an MTT assay and cell counts were calculated using a standard curve. The results demonstrate logarithmic growth of all the cultures, with no single culture exhibiting any significant difference compared to any other. B. Karyotypes were generated from all MSC donors used here both before and after lentiviral transduction. Shown here is a representative karyotype from MSC donor 2627 transduced with shHTT at an MOI of 80, demonstrating lack of any chromosomal changes. C. MSC from donor 2627 were transduced with shGFP, shHTT, and shSCRAM at an MOI of 100 and were then differentiated, along with wild type MSC, using osteogenic and adipogenic inducing media for 17 days. All cultures demonstrated robust differentiation into adipocytes and osteoblasts. Shown are representative images from MSCshHTT stained with either Oil Red O (top row) at 200× magnification or Alizarin Red (bottom row). Adipogenic differentiation is indicated by the presence of red lipid-containing vesicles in the cell (top row, right), while osteogenic differentiation is confirmed by the presence of calcified extracellular matrix stained red by Alizarin Red dye (bottom row, middle). There was no appreciable accumulation of lipid or calcified matrix in the non-induced wells (left).
Fig. 3
Fig. 3
Reduction in GFP from shGFP as measured by flow cytometry. To test the activity of GFP targeted shRNA, U87HTT142gfp cells were transduced with shGFPdsRed-mito. Cell cultures were collected at day 0, 2, 4 and 6 and were assayed by flow cytometry. A. The green fluorescence of each culture is shown in this histogram overlay. Reduced GFP expression is evident after only two days (yellow) compared to starting levels at day 0 (green). GFP expression continues to decrease at day 4 (orange) after which only a slight decrease of 4dEGFP expression is seen on day 6 (red). B. Overlaid dot plots of the four time points reveals the progressive decrease in green fluorescence (x-axis) while expression of dsRed increases (y-axis) causing the populations to shift from bottom right to upper left of the plot. C. When compared to no shRNA (green triangle), and shHTT (red square), shGFP (blue diamond) shows a progressive and dramatic protein reduction. Populations were gated for GFP expression (shown in A) on day 0 and percent GFP-positive was subsequently measured.
Fig. 4
Fig. 4
Detection and silencing of HTT142 by shHTT. U87 cells were transduced to express HTT142 and GFP as a transduction reporter. A. Cell lysates from both wild type U87 cells and U87HTT142gfp cells were collected and proteins were analyzed by Western blot. Anti-HTT antibody revealed the expression of HTT142 as an approximately 92 kDa band present only in U87HTT142gfp cells. B. U87HTT142gfp cells were then transduced with either shHTT or shGFP lentivirus, and culture lysates were collected on day 2, 3, 5, and 9 and compared by Western blot. C. Protein levels were quantified using densitometry and HTT142 expression was normalized to actin. shHTT transduction progressively silenced HTT142 expression through day 9 (gray diamond), while the control shGFP transduction had no appreciable effect (black square).
Fig. 5
Fig. 5
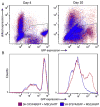
RNAi transfer in co-culture reduces 4dGFP reporter expression. SH-SY5Y cells expressing 4dGFP as an RNAi activity reporter were co-cultured with either MSC expressing shGFPdsRed or shHTTdsRed as a control (see Supplemental Fig. 1). A. Dot plots of day 4 cultures (left) contain a distinct dsRed-positive 4dGFP-negative shRNA expressing MSC (parallel to the y-axis) and dsRed-negative 4dGFP-positive SH-SY5Ys in both moderate and high subpopulations (parallel to the x-axis). The MSCshHTT (red) and MSCshGFP (blue) cultures are indistinguishable at this point. However, on day 10 (right), the culture containing MSCshGFP had a marked decrease in green fluorescence, evident by the complete loss of the 4dGFP-high and a shift left in the more moderately expressing SH-SY5Ys as well. B. The co-cultures were then gated to analyze only dsRed-negative GFP-positive SH-SY5Ys and GFP expression was plotted on overlaid histograms (gates shown on the respective dot plots in A). At day 4 (left) the overlaid histograms show identical peaks. At day 10, however, the cultures had become significantly different, as the culture containing MSCshGFP (blue) had a remarkable reduction in GFP expression when compared to MSCshHTT (red).RNAi transfer in co-culture reduces 4dGFP reporter expression. SH-SY5Y cells expressing 4dGFP as an RNAi activity reporter were co-cultured with either MSC expressing shGFPdsRed or shHTTdsRed as a control (see Supplemental Fig. 1). A. Dot plots of day 4 cultures (left) contain a distinct dsRed-positive 4dGFP-negative shRNA expressing MSC (parallel to the y-axis) and dsRed-negative 4dGFP-positive SH-SY5Ys in both moderate and high subpopulations (parallel to the x-axis). The MSCshHTT (red) and MSCshGFP (blue) cultures are indistinguishable at this point. However, on day 10 (right), the culture containing MSCshGFP had a marked decrease in green fluorescence, evident by the complete loss of the 4dGFP-high and a shift left in the more moderately expressing SH-SY5Ys as well. B. The co-cultures were then gated to analyze only dsRed-negative GFP-positive SH-SY5Ys and GFP expression was plotted on overlaid histograms (gates shown on the respective dot plots in A). At day 4 (left) the overlaid histograms show identical peaks. At day 10, however, the cultures had become significantly different, as the culture containing MSCshGFP (blue) had a remarkable reduction in GFP expression when compared to MSCshHTT (red).
Fig. 6
Fig. 6
Reduction in HTT142 after co-culture with shHTT-expressing MSC. U87HTT142gfp cells were treated with mitomycin C to induce growth arrest prior to being seeded with either MSC expressing shHTT or shGFP as a control. Cell lysate was then harvested from co-cultures on day 0, 2, 3, 5, and 9. A. Lysates were analyzed for expression of HTT142, GFP, and actin using Western blot. A progressive reduction of HTT142 is visible over time. B. Densitometry was used to quantify HTT142 normalized to actin. Cultures containing MSCshHTT (black diamond) demonstrated a progressive and consistent decrease in HTT142 over the time course. In contrast, cultures containing MSCshGFP only exhibited a slight decrease in HTT142.
Fig. 7
Fig. 7
Transient decrease in HTT142 after culture with shHTT-expressing MSC. SH-SY5YHTT142gfp cells were co-cultured with MSCshHTT or MSCshSCRAM in either serum free medium or medium containing only 5% FBS in order to slow cell proliferation. Cultures were then harvested for protein on days 0, 3, 5, and 7 and assayed using Western blot for HTT142, GFP, and actin (not shown) as a loading control for both 0% and 5% FBS cultures (A and B respectively). C. Protein expression for the two sets of co-cultures was then analyzed using densitometry. Both sets of co-cultures show a dramatic dip in HTT142 expression on day 5, followed by a recovery to near start levels in the cultures containing MSCshHTT (black diamond) when normalized to the co-expressed GFP. However, the control cultures containing MSCshSCRAM (gray square) showed no such pattern, with HTT142 levels either slightly increasing or decreasing.

Similar articles

Cited by

References

    1. Bauer G, Dao MA, Case SS, Meyerrose T, Wirthlin L, Zhou P, Wang X, Herrbrich P, Arevalo J, Csik S, Skelton DC, Walker J, Pepper K, Kohn DB, Nolta JA. In vivo biosafety model to assess the risk of adverse events from retroviral and lentiviral vectors. Mol Ther. 2008;16:1308–1315. - PMC - PubMed
    1. Biedler JL, Roffler-Tarlov S, Schachner M, Freedman LS. Multiple neurotransmitter synthesis by human neuroblastoma cell lines and clones. Cancer Res. 1978;38:3751–3757. - PubMed
    1. Boudreau RL, McBride JL, Martins I, Shen S, Xing Y, Carter BJ, Davidson BL. Nonallele-specific silencing of mutant and wild-type huntingtin demonstrates therapeutic efficacy in Huntington’s disease mice. Mol Ther. 2009;17:1053–1063. - PMC - PubMed
    1. Boudreau RL, Rodriguez-Lebron E, Davidson BL. RNAi medicine for the brain: progresses and challenges. Hum Mol Genet. 2011;20:R21–R27. - PMC - PubMed
    1. Bruno S, Grange C, Deregibus MC, Calogero RA, Saviozzi S, Collino F, Morando L, Busca A, Falda M, Bussolati B, Tetta C, Camussi G. Mesenchymal stem cell-derived microvesicles protect against acute tubular injury. J Am Soc Nephrol. 2009;20:1053–1067. - PMC - PubMed

Publication types