. 2012 Mar;222(1):1-17.
doi: 10.1007/s00427-011-0384-2. Epub 2011 Dec 24.

Molecular mechanisms of EGF signaling-dependent regulation of pipe, a gene crucial for dorsoventral axis formation in Drosophila

Affiliations

Molecular mechanisms of EGF signaling-dependent regulation of pipe, a gene crucial for dorsoventral axis formation in Drosophila

Martin Technau et al. Dev Genes Evol. 2012 Mar.

Abstract

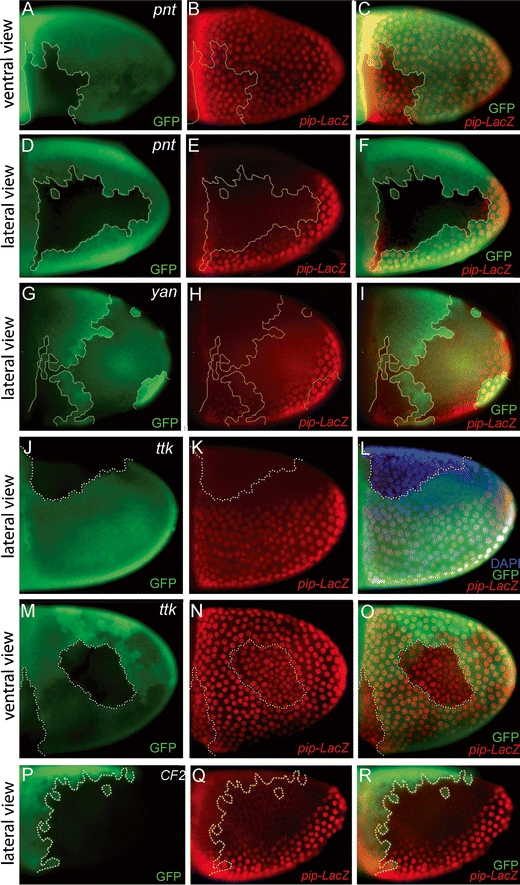
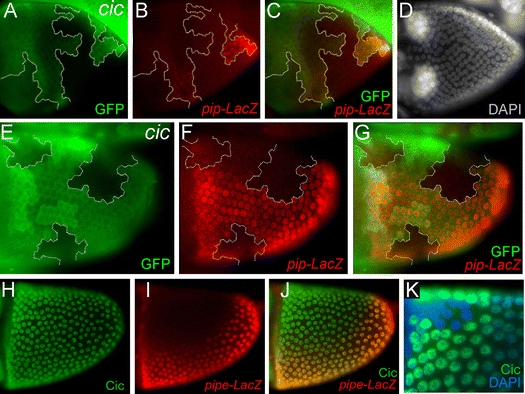
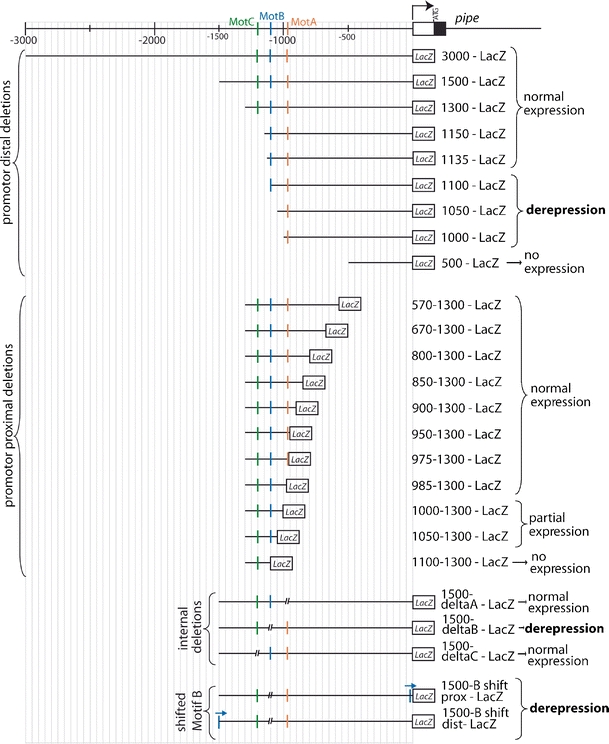
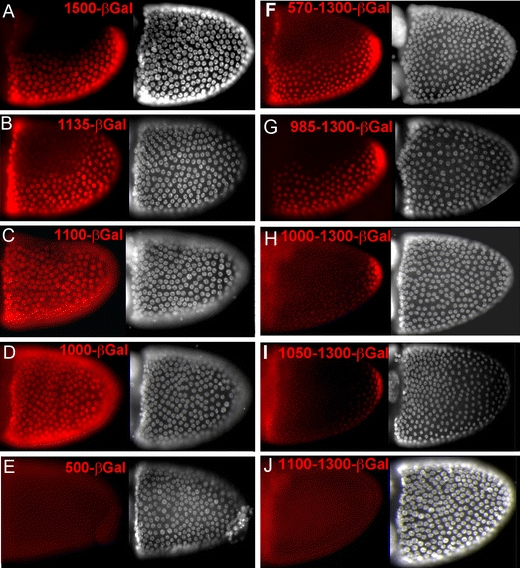
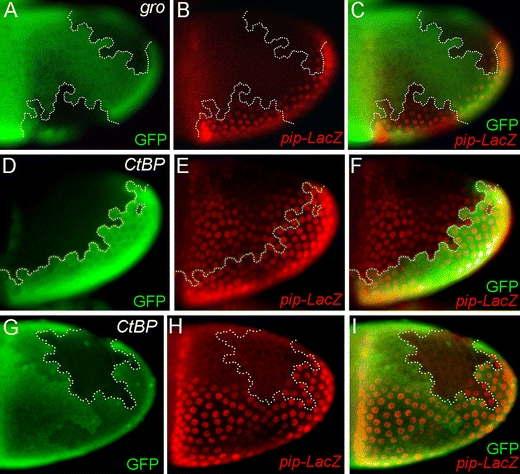
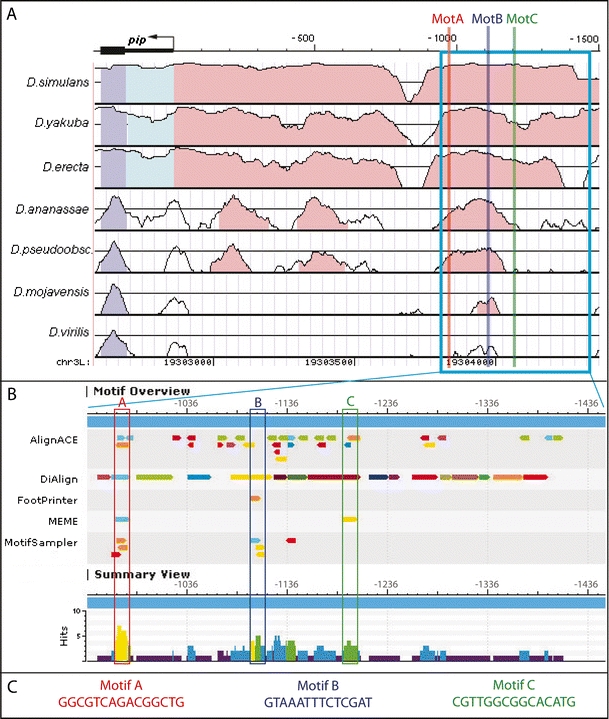
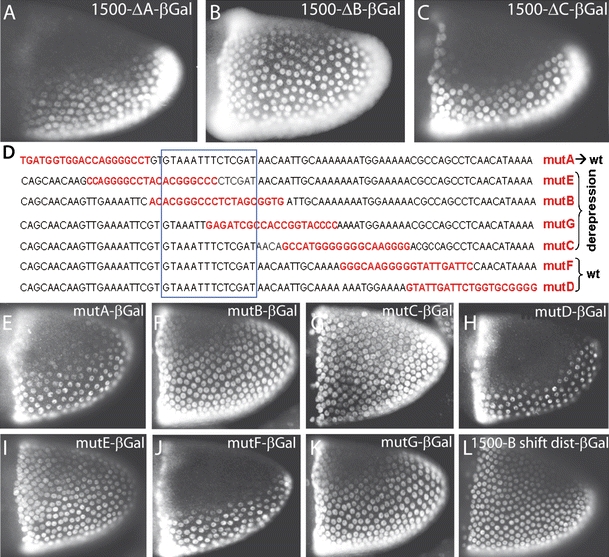
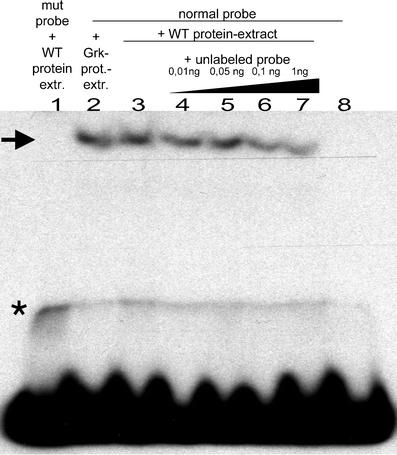
During Drosophila oogenesis the expression of the sulfotransferase Pipe in ventral follicle cells is crucial for dorsoventral axis formation. Pipe modifies proteins that are incorporated in the ventral eggshell and activate Toll signaling which in turn initiates embryonic dorsoventral patterning. Ventral pipe expression is the result of an oocyte-derived EGF signal which down-regulates pipe in dorsal follicle cells. The analysis of mutant follicle cell clones reveals that none of the transcription factors known to act downstream of EGF signaling in Drosophila is required or sufficient for pipe regulation. However, the pipe cis-regulatory region harbors a 31-bp element which is essential for pipe repression, and ovarian extracts contain a protein that binds this element. Thus, EGF signaling does not act by down-regulating an activator of pipe as previously suggested but rather by activating a repressor. Surprisingly, this repressor acts independent of the common co-repressors Groucho or CtBP.


Figures

Fig. 1
Fig. 1
pipe repression is normal in follicle cell clones lacking the activity of transcription factors known to act downstream of EGF signaling. Stage 10 egg chambers are oriented with the anterior pole to the left. The dorsoventral orientation (lateral or ventral surface view) is indicated at the left side. Mutant cell clones are marked by the absence of GFP (green). pipe expression is monitored using a pipe-LacZ and anti-βGal antibody staining (red). af pnt ∆88 mutant follicle cell clones. ac Ventral view; ventrally localized pnt ∆88 clone. df Lateral view; dorso-lateral pnt ∆88 clones. gi yan XE18 clones extending from ventral to dorsal. jo ttk 1E11 mutant follicle cell clones, nuclei are labeled with DAPI in (l). jl Lateral view; dorsally localized ttk 1E11 clones. mo Ventral view; ventral localized ttk 1E11 clones. l, o The nuclei are more densely packed in ttk 1E11 mutant tissue as compared to the surrounding wildtypic tissue. pr Clones homozygous for Df(2L)γ27. The deficiency Df(2L)γ27 deletes the complete coding region and about 20 kb upstream of CF2. In all cases, the mutant follicle cell clones do not affect the proper expression pattern of pipe and thus all the tested candidate transcription factors are apparently not involved in the transcriptional regulation of pipe
Fig. 2
Fig. 2
Clonal analysis and protein distribution of the HMG-Box transcription factor Capicua (Cic). Stage 9 (ad) and 10 (ek) egg chambers oriented with the anterior pole to the left and the dorsal side upwards. ag cic fetU6 mutant follicle cell clones are marked by the absence of GFP (green). pipe expression is monitored using a pipe-LacZ and anti-βGal antibody staining (red). The nuclei are stained with DAPI (white). Early (ad) and late (eg) pipe expression depends on cic activity in a cell-autonomous fashion. hk Cic protein distribution in stage 10 egg chambers. Cic shows uniform concentrations in lateral follicle cell nuclei where the boundary of the pipe expression domain is positioned. k Cic protein amount is reduced in a small patch of nuclei at the dorsal side of stage 10 egg chambers. The panel shows a different focal plane of the same egg chamber depicted in (hj). The nuclei are stained with DAPI (blue)
Fig. 3
Fig. 3
Reporter constructs identify a repressor element within the minimal cis-regulatory region driving normal pipe expression. The schematic drawing at the top represents the sequence region at the transcription start site of the pipe locus, extending 3,000 bp upstream and 1,000 bp downstream. The chromosomal orientation is inverted. The cloned reporter constructs are depicted below. The black lines mark the extent of the promoter fragments driving the expression of the LacZ reporter gene (LacZ). The position of the motifs A–C identified by TFBS prediction software (see Fig. 6) is marked with colored bars. The effects on pipe repression are indicated on the right
Fig. 4
Fig. 4
Expression patterns of terminally deleted pipe reporter constructs. Stage 10 egg chambers oriented with the anterior pole to the left and the dorsal side upwards. The expression pattern of the LacZ reporter gene is visualized by anti-βGal antibody staining (red, left column). The DAPI staining (white, right column) demonstrates the integrity of the follicular epithelium. ae Reporter constructs comprising distally deleted promoter fragments. fj Reporter constructs comprising proximally deleted promoter fragments. The expression patterns are discussed in the text. See also Fig. 3
Fig. 5
Fig. 5
pipe repression does not require the co-repressors Groucho or CtBP. ai Stage 10 egg chambers oriented with the anterior pole to the left and the dorsal side upwards. Mutant follicle cell clones are marked by the absence of GFP (green). A pipe-LacZ construct reflecting the expression of pipe is visualized using an anti-βGal antibody (red). ac Ventrally and dorsally localized gro E48 clones, df large CtBP P1590 clone extending from ventral to dorsal. To reveal the ventral border of the clone, the egg chamber is shown from a ventrolateral view. Therefore, the pipe domain appears to expand more to the dorsal side as compared to lateral views. gi Dorsally localized CtBP P1590 clone
Fig. 6
Fig. 6
Evolutionary conservation and identification of potential TFBS in the cis-regulatory region upstream of pipe. a Plots of pair-wise alignments of the upstream region of pipe generated by GenomeVISTA. The Drosophila species used for the alignment with D. melanogaster is depicted on the left. The schematic drawing of the pipe upstream region at the top shows the coordinates of the upstream sequence, the transcription start site is marked by an arrow; the coding region of pipe is illustrated by the thick black bar. Because pipe is encoded on the reverse complement, the core promoter and the transcription start side are located at the right side and the upstream cis-regulatory sequence extends to the left. The graphs represent the conservation above 50%, the upper line marks 100% conservation. The colored shadings of the graphs depict conserved regions (70% minimal identity within at least 100 bp). Conserved translated regions are dark blue, non-coding transcribed regions are light blue, non-transcribed regions are red. The blue open box marks the ~500 bp sequence region used in the analysis with the TFBS prediction software. The position of the motifs A–C identified by this software is depicted by the vertical bars (red, blue, and green). b Graphical representation of the CREDO results. The Motif Overview at the top illustrates the position of all detected motifs. The individual hits for the different consensus motifs are depicted in one individual block for each program as colored arrows. Each individual color represents one specific consensus motif. The Summary View below shows the motifs found by all programs for each nucleotide position. The color code represent the number of different programs that detected a motif at that specific position (purple: one out of five; light blue: two; green: three; yellow: four; red: five). The number of total motif hits at each position is indicated by the height of the bar (some programs detect several overlapping motifs at the same position). The colored open boxes mark the location of the motifs A–C that are predicted by most programs, including the results of the programs MOST, SOMBRERO, and WeederH which are not implemented in CREDO. c Sequence of the motifs A, B, and C predicted by at least five different algorithms
Fig. 7
Fig. 7
Expression patterns of internally deleted or mutated pipe promoter constructs. Stage 10 egg chambers oriented with the anterior pole to the left and the dorsal side upwards. The expression pattern of the LacZ reporter gene is visualized by anti-β-Gal antibody staining (red). ac Internally deleted promoter constructs. The constructs include 1,500 bp of the pipe upstream region. In each case, one of the predicted motifs A–C (see Fig. 6c) is deleted. Only the deletion of motif B leads to a clear de-repression (uniform expression). d The sequences surrounding motif B (marked by an open blue box) which are modified (highlighted in red) in the reporter constructs mutA–mutD. The effects on pipe repression are indicated on the right. ek Expression patterns of the reporter constructs mutA–mutD. l Expression pattern of a construct in which the 31-bp repressor element was shifted to a more distal position (see Fig. 3)
Fig. 8
Fig. 8
EMSA with ovarian protein extract using a radioactively labeled 31-bp repressor element probe. Lane 1: mutated probe incubated with protein extract from wild-type ovaries; lane 2: normal probe (31-bp pipe promoter fragment) incubated with protein extract from grk HF48 /grk 2B6 ovaries; lane 3: normal probe incubated with protein extract from wild-type ovaries; lanes 47: normal probe incubated with protein extract from wild-type ovaries plus increasing amounts of non-labeled probe; lane 8: normal probe only. 0.1 ng of radioactively labeled probe (mutated or normal) were used. The arrow marks the bandshift that occurs after incubation with protein extracts from grk HF48 /grk 2B6 or wild-type ovaries. The asterisk marks a band which is also observed in the case of the mutated probe due to unspecific binding. The strong band at the bottom results from unbound probe. The addition of increasing amount of unlabeled probe as cold competitor reduces the strength of the band-shift (lanes 24). The mutated probe does not result in a bandshift when incubated (lane 1). Thus, the bandshift is caused by specific binding of one or more proteins to the 31-bp element

Similar articles

Cited by

References

    1. Arnosti DN, Gray S, Barolo S, Zhou J, Levine M. The gap protein knirps mediates both quenching and direct repression in the Drosophila embryo. Embo J. 1996;15:3659–3666. - PMC - PubMed
    1. Astigarraga S, Grossman R, Diaz-Delfin J, Caelles C, Paroush Z, Jimenez G. A MAPK docking site is critical for downregulation of Capicua by Torso and EGFR RTK signaling. Embo J. 2007;26:668–677. - PMC - PubMed
    1. Atkey MR, Lachance JF, Walczak M, Rebello T, Nilson LA. Capicua regulates follicle cell fate in the Drosophila ovary through repression of mirror. Development. 2006;133:2115–2123. - PubMed
    1. Bailey TL, Elkan C. Fitting a mixture model by expectation maximization to discover motifs in biopolymers. Proc Int Conf Intell Syst Mol Biol. 1994;2:28–36. - PubMed
    1. Bailey TL, Elkan C. The value of prior knowledge in discovering motifs with MEME. Proc Int Conf Intell Syst Mol Biol. 1995;3:21–29. - PubMed

Publication types

MeSH terms

LinkOut - more resources