. 2012 Mar;45(3):1101-10.
doi: 10.1016/j.nbd.2011.12.028. Epub 2011 Dec 16.

Metabotropic glutamate receptor-dependent long-term depression is impaired due to elevated ERK signaling in the ΔRG mouse model of tuberous sclerosis complex

Affiliations

Metabotropic glutamate receptor-dependent long-term depression is impaired due to elevated ERK signaling in the ΔRG mouse model of tuberous sclerosis complex

Itzamarie Chévere-Torres et al. Neurobiol Dis. 2012 Mar.

Abstract

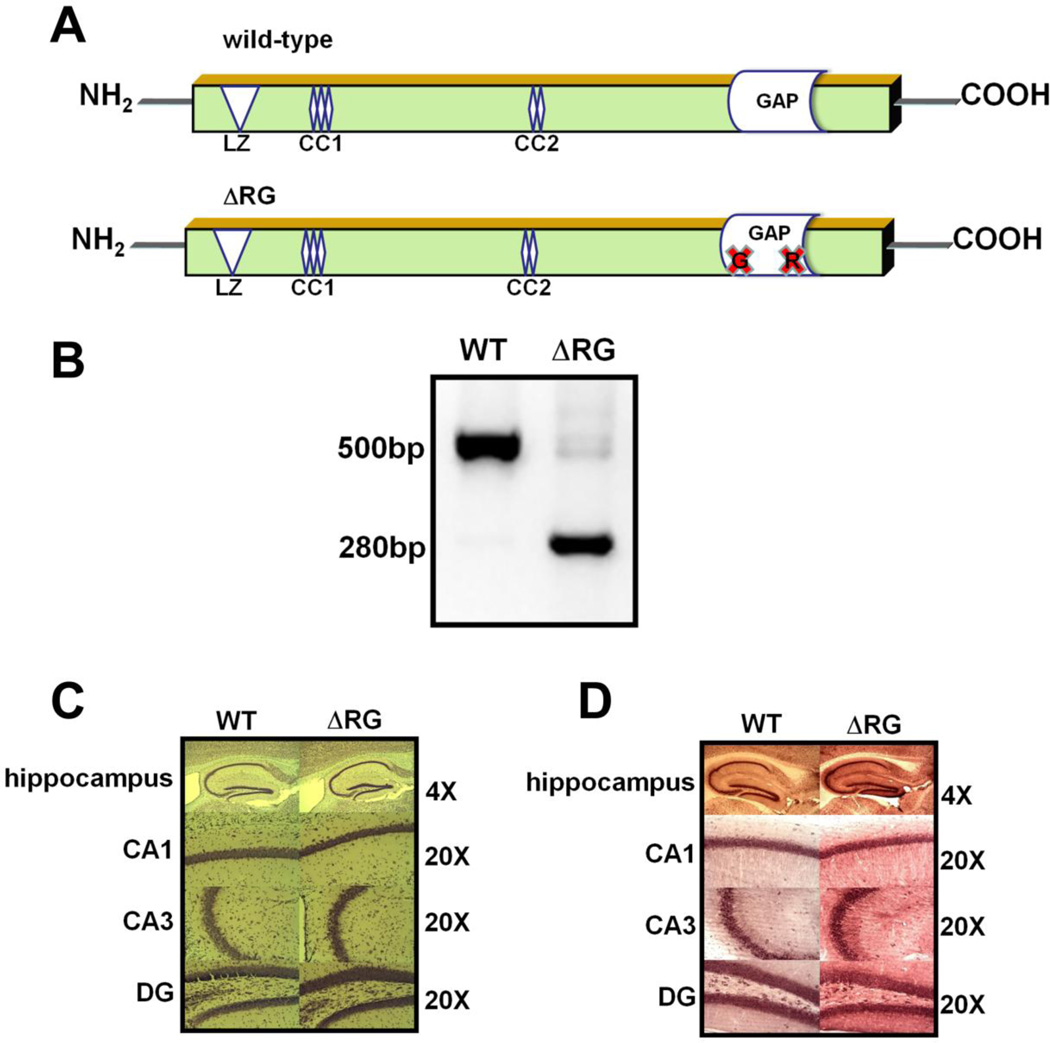
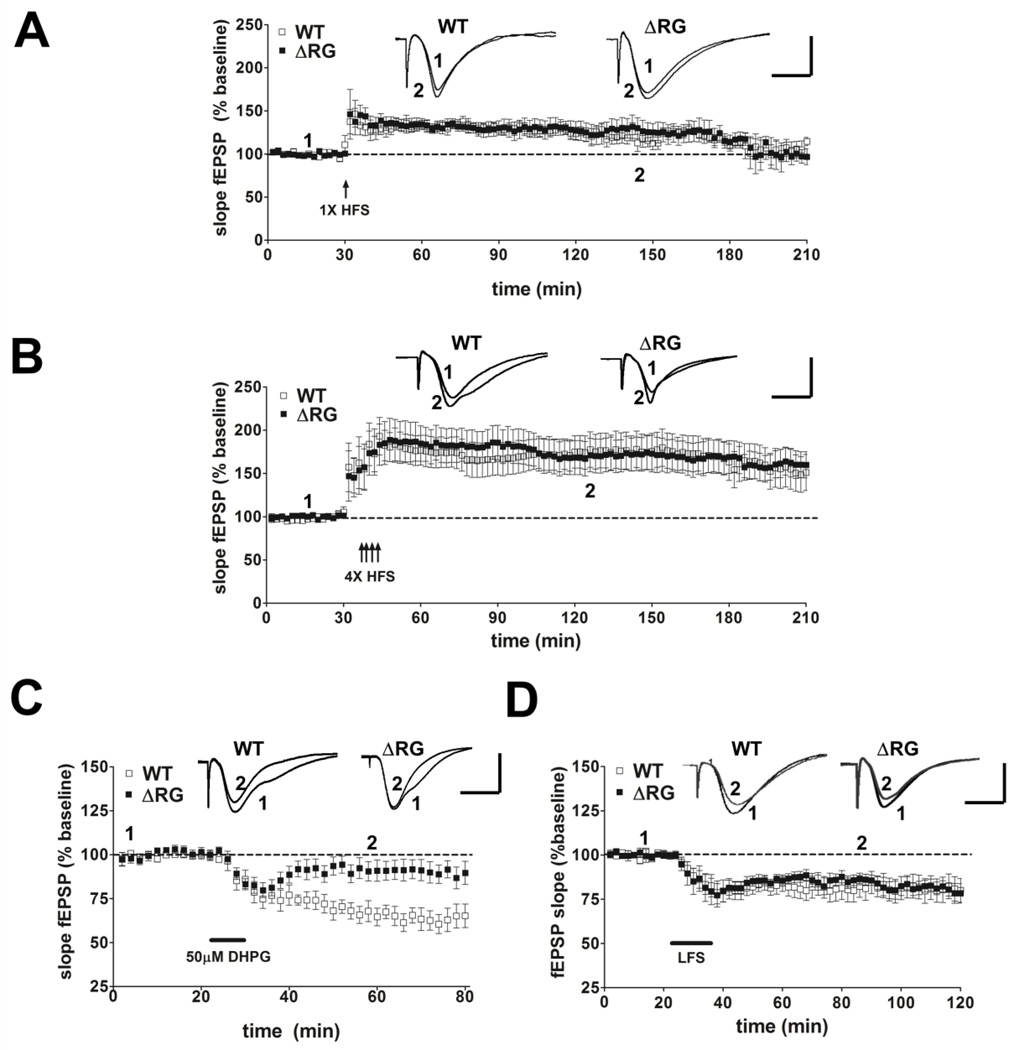
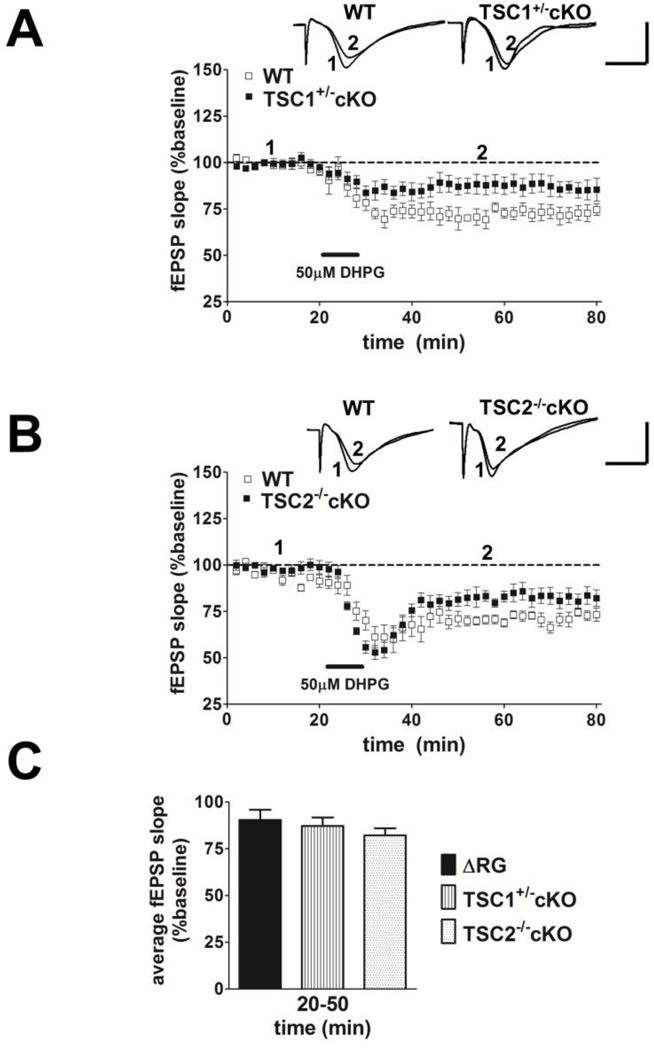
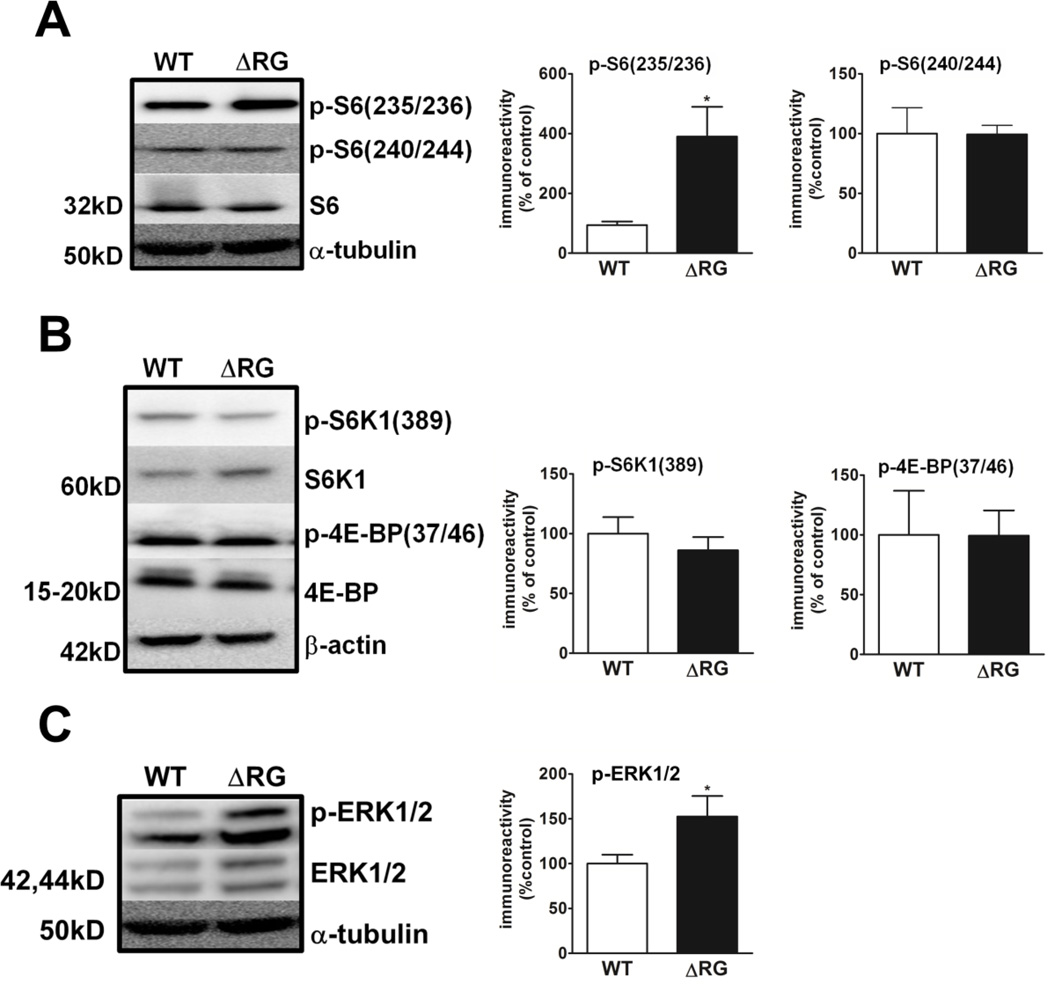
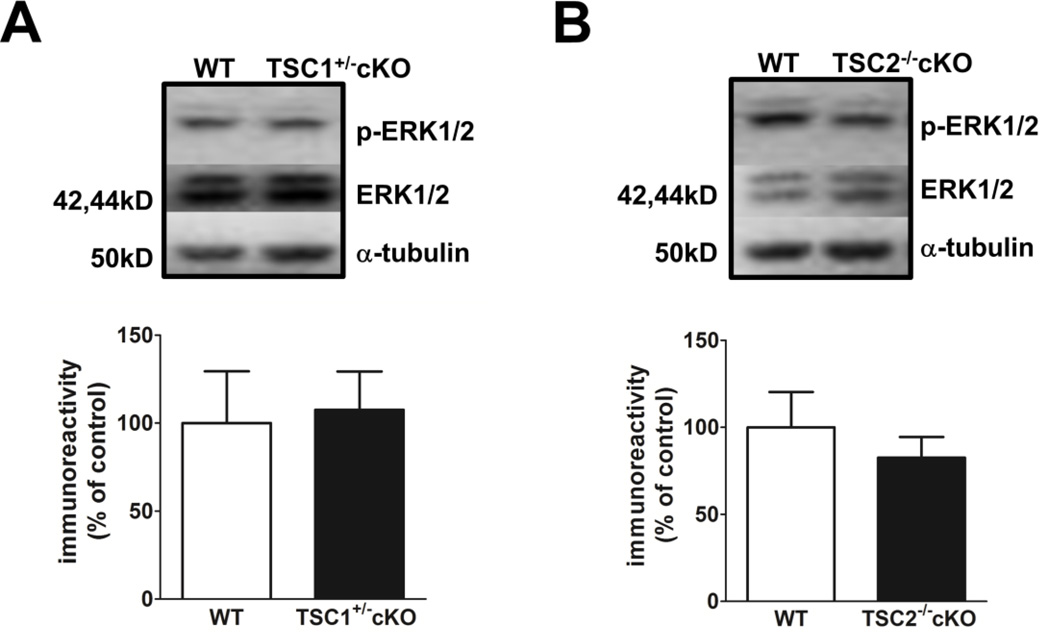
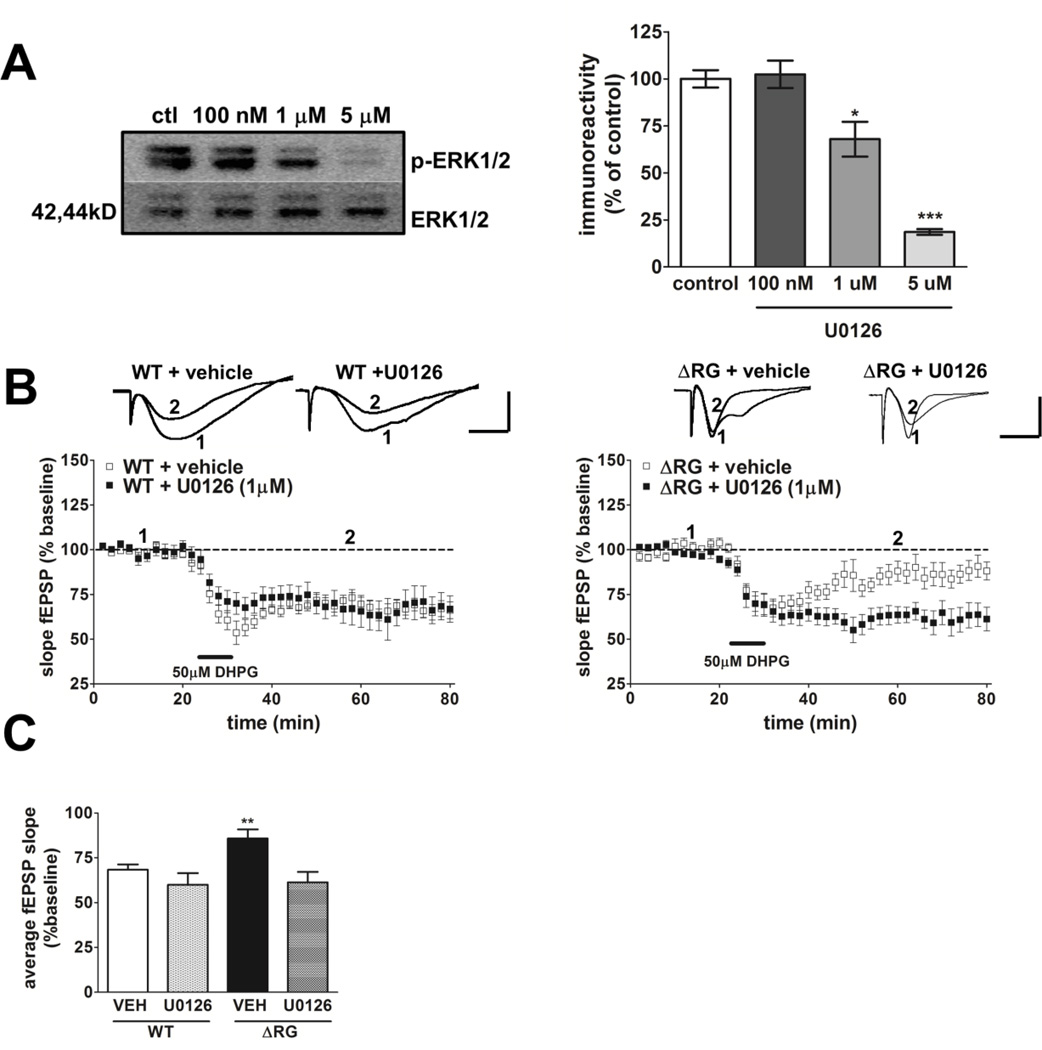
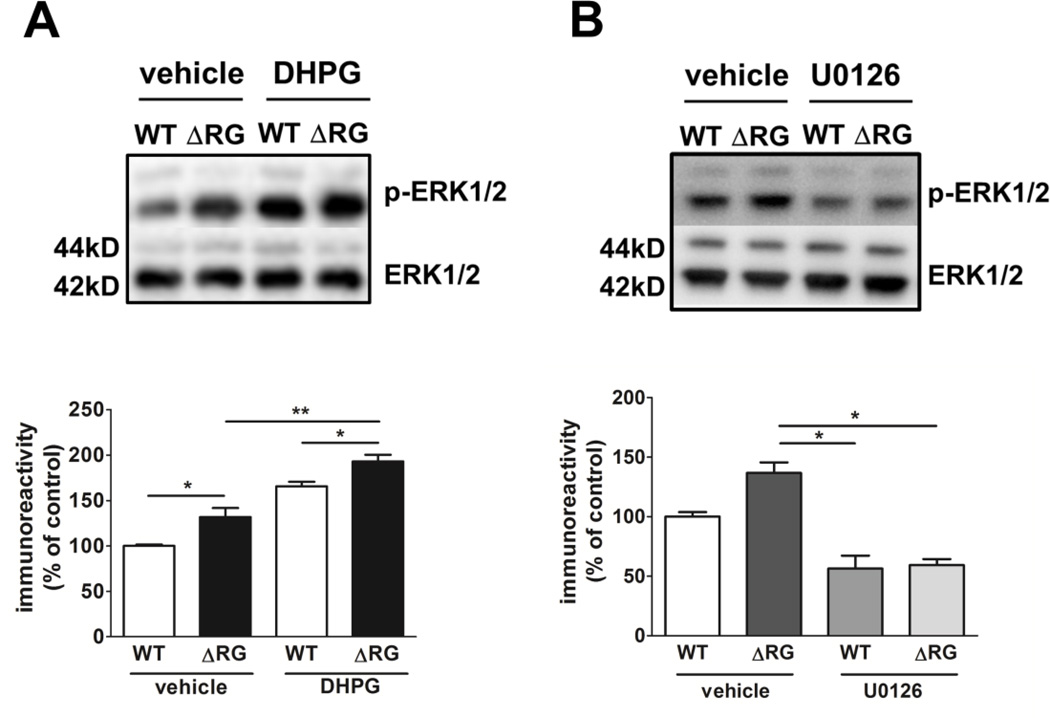
Tuberous sclerosis complex (TSC) and fragile X syndrome (FXS) are caused by mutations in negative regulators of translation. FXS model mice exhibit enhanced metabotropic glutamate receptor-dependent long-term depression (mGluR-LTD). Therefore, we hypothesized that a mouse model of TSC, ΔRG transgenic mice, also would exhibit enhanced mGluR-LTD. We measured the impact of TSC2-GAP mutations on the mTORC1 and ERK signaling pathways and protein synthesis-dependent hippocampal synaptic plasticity in ΔRG transgenic mice. These mice express a dominant/negative TSC2 that binds to TSC1, but has a deletion and substitution mutation in its GAP-domain, resulting in inactivation of the complex. Consistent with previous studies of several other lines of TSC model mice, we observed elevated S6 phosphorylation in the brains of ΔRG mice, suggesting upregulated translation. Surprisingly, mGluR-LTD was not enhanced, but rather was impaired in the ΔRG transgenic mice, indicating that TSC and FXS have divergent synaptic plasticity phenotypes. Similar to patients with TSC, the ΔRG transgenic mice exhibit elevated ERK signaling. Moreover, the mGluR-LTD impairment displayed by the ΔRG transgenic mice was rescued with the MEK-ERK inhibitor U0126. Our results suggest that the mGluR-LTD impairment observed in ΔRG mice involves aberrant TSC1/2-ERK signaling.


Figures

Figure 1
Figure 1
Overexpression of ΔRG TSC2 protein in mouse hippocampus. (A) Schematic representation of the dominant negative TSC2 ΔRG in mice that model tuberous sclerosis. (B) PCR identification of ΔRG transgene showed a corresponding band at 280bp. The wild-type band is detected at 500bp. (C) Hippocampal morphology in ΔRG mice. Nissl staining of saggital sections showed no obvious aberrant morphology. (D) Immunolocalization of TSC2 in the mouse hippocampus. Increased levels of TSC2 were observed in hippocampal areas CA1 and CA3, and the dentate gyrus (DG) of ΔRG mice compared to WT mice.
Figure 2
Figure 2
ΔRG mice have normal basal synaptic transmission and paired-pulse facilitation. (A) Input/output plot indicates that both wild-type (WT) and ΔRG mice had comparable fEPSP slopes with increasing stimulation intensities, indicating normal postsynaptic function (WT, n=16; ΔRG, n=13; 2–3 slices/mouse per genotype. P<0.05, ANOVA). (B) Input/output plot indicates that both wild-type (WT) and ΔRG mice had comparable fiber volley amplitude with increasing stimulation intensities, indicating normal presynaptic function (WT, n=14; ΔRG, n=17; 2–3 slices/mouse per genotype. P<0.05, ANOVA). (C) ΔRG mice exhibit normal paired-pulse facilitation (PPF) compared to their WT littermates using interpulse intervals ranging from 10 to 300 ms. The percent of facilitation was calculated from the ratio of the second fEPSP to the first fEPSP (WT, n=8; ΔRG, n=8; 2–3 slices/mouse per genotype. P<0.05, ANOVA).
Figure 3
Figure 3
ΔRG mice have normal hippocampal E-LTP, L-LTP and NMDAR-LTD but have impaired mGluR-LTD. (A) Top, representative fEPSPs in slices from wild-type (WT) and ΔRG mice before and after receiving one train of HFS. Calibration: 5 mV, 5 ms. Bottom, a single train of HFS elicits similar levels of E-LTP in WT and ΔRG mice (WT, n= 7; ΔRG, n=7; 2–3 slices/mouse per genotype. P>0.05, ANOVA). (B). Top, representative fEPSPs in slices from WT and ΔRG mice before and after receiving four trains of HFS. Bottom, four trains of HFS elicited similar levels of L-LTP in WT and ΔRG mice (WT, n=10; ΔRG, n=15; 2–3 slices/mouse per genotype. P>0.05, ANOVA). (C) Top, representative fEPSPs in slices from WT and ΔRG mice before and after treatment with DHPG (50 µM, 10 min) to induce mGLUR-LTD. Bottom, DHPG application induced LTD in WT mice, but not in ΔRG mice (WT, n=7; ΔRG, n=8; 2–3 slices/mouse per genotype. **p<0.01, ANOVA). (D) Top, representative fEPSPs in slices from wild-type (WT) and ΔRG mice before and after receiving 900 pulses of LFS for 15 min. Bottom, LFS elicits similar levels of NMDR-LTD in WT and ΔRG mice (WT, n= 12; ΔRG, n=12; 3 slices/mouse per genotype. P>0.05, ANOVA).
Figure 4
Figure 4
mGluR-LTD is impaired in mice with conditional deletions of TSC1 and TSC2. (A) Top, representative fEPSPs in slices from WT and TSC1+/− cKO mice before and after treatment with DHPG (50 µM, 10 min) to induce mGLUR-LTD. Calibration: 5 mV, 5 ms. Bottom, DHPG application induced LTD in WT mice and impaired LTD in TSC1+/− cKO (WT, n=4; TSC1+/− cKO, n=8; 2–3 slices/mouse per genotype. *p<0.05, ANOVA). (B) Top, representative fEPSPs in slices from WT and TSC2−/− cKO mice before and after treatment with DHPG (50µM, 10 min) to induce mGLUR-LTD. Bottom, DHPG application induced LTD in WT mice and impaired LTD in TSC2−/− cKO (WT, n=8; TSC2−/− cKO, n=4; 1–2 slices/mouse per genotype. *p<0.05, ANOVA). (C) Bar graph depicting average fEPSP slope 20 to 50 min after the washout of DHPG. DHPG application induced same level of mGluR-LTD in ΔRG, TSC1+/− cKO, and TSC2−/− cKO mice (ΔRG, n=8; TSC1+/− cKO, n=8; TSC2−/− cKO, n=4. p>0.05, Student’s t-test compared with ΔRG for the given time period).
Figure 5
Figure 5
mTORC1 signaling is unaltered, but S6 and ERK phosphorylation are elevated in the hippocampus of ΔRG mice. (A) S6 phosphorylation at serine 235/236 is increased, whereas phosphorylation at serine 240/244 is not altered in the hippocampus of ΔRG mice (WT, n=3; ΔRG n=4. *p<0.05, Student’s t-test). (B) Phosphorylation of 4E-BP (WT, n=3; ΔRG n=3). P>0.05, Student’s t-test) and S6K1 are unaltered (WT, n=4; ΔRG n=6). P>0.05, Student’s t-test) in ΔRG mice. (C) ERK1/2 phosphorylation is increased in ΔRG mice (WT, n=3; ΔRG n=3). *p<0.05, Student’s t-test). Phospho-protein phosphorylation immunoreactivity was normalized to tubulin and its corresponding total protein immunoreactivity.
Figure 6
Figure 6
ERK signaling is unaltered in the hippocampus of TSC1+/− cKO and TSC2−/− cKO mice. (A) Basal ERK1/2 phosphorylation is normal in TSC1+/− cKO mice (WT, n=3; TSC1+/− cKO, n=3). P>0.05, Student’s t-test). (B) Basal ERK1/2 phosphorylation is normal in TSC2−/− cKO mice (WT, n=3; TSC2−/− cKO, n=3). P>0.05, Student’s t-test). ERK1/2 phosphorylation immunoreactivity was normalized to tubulin and total ERK1/2 immunoreactivity.
Figure 7
Figure 7
Impaired mGluR-LTD in ΔRG mice is rescued by inhibition of MEK-ERK signaling. (A) Incubation of wild-type (WT) hippocampal slices for 30 min with 100 nM U0126 did not alter, whereas incubation with 1 µM and 5 µM U0126 significantly decreased ERK phosphorylation (n=6 mice; 2–3 slices per treatment. ***p<0.0001, one-way ANOVA analysis followed by Dunnett’s test [control vs. 100 nM, p>0.05; control vs. 1 µM, **p<0.001; control vs. 5 µM, ***p<0.0001]). (B) Left panel: Top, representative fEPSPs in slices from WT mice before and after treatment with DHPG (50 µM, 10 min) to induce mGluR-LTD in the presence of either vehicle (DMSO) or U0126 (1µM). Calibration: 5 mV, 5 ms. Bottom, mGluR-LTD was induced by DHPG application in the presence of either vehicle or 1 µM U0126 in WT mice (WT + vehicle, n=14; WT + U0126, n=14; 1–2 slices/mouse per drug treatment. P>0.05, ANOVA). Right panel: top, representative fEPSPs in slices from ΔRG mice before and after treatment with DHPG (50 µM, 10 min) to induce mGluR-LTD in the presence of either vehicle or U0126 (1µM). Bottom, mGluR-LTD was induced by DHPG application in the presence of 1 µM U0126, but not vehicle, in ΔRG mice (ΔRG + vehicle, n=12; ΔRG + U0126, n=13; 1–2 slices/mouse per drug treatment. ***p<0.0001, ANOVA). The vehicle and U0126 was present before, during and after DHPG application. (C) Left panel: bar graph depicting average fEPSP slope 20 to 50 min after the washout of DHPG in the presence of either vehicle or U0126 (WT + vehicle, n=14; WT + U0126, n=14; ΔRG + vehicle, n=12; ΔRG + U0126, n=13; **p<0.01, one-way ANOVA; [**p<0.05, Student’s t-test compared with ΔRG + vehicle for the given time period]).
Figure 8
Figure 8
Biochemical analysis of MEK/ERK signaling inhibition during mGluR-LTD induction in ΔRG mice. (A) ERK phosphorylation is further increased in area CA1 of hippocampal slices from ΔRG mice after treatment with DHPG (50 µM, 10 min) compared to hippocampal slices from wild-type (WT) mice treated with DHPG (n=3–4 slices per treatment. ***p<0.0001, one-way ANOVA analysis. Student’s t-test [WT+ vehicle vs. ΔRG + vehicle, *p<0.05; WT+ DHPG vs. ΔRG + DHPG, *p<0.05; ΔRG + vehicle vs. ΔRG + DHPG, **p<0.01; WT + vehicle vs. WT + DHPG, ***p<0.0001]. (B) ERK phosphorylation is decreased in area CA1 from both WT and ΔRG hippocampal slices treated with U0126 (1 µM) after mGluR-LTD compared to control DMSO (n=6–8 slices per treatment. **p<0.01, one-way ANOVA analysis followed by Bonferroni’s test [ΔRG + vehicle vs. WT + U0126, *p<0.05; ΔRG + vehicle vs. ΔRG + U0126, *p<0.05]).

References

    1. Banko JL, et al. Regulation of eukaryotic initiation factor 4E by converging signaling pathways during metabotropic glutamate receptor-dependent long-term depression. J Neurosci. 2006;26:2167–2173. - PMC - PubMed
    1. Bateup HS, et al. Loss of Tsc1 In Vivo Impairs Hippocampal mGluR-LTD and Increases Excitatory Synaptic Function. J Neurosci. 2011;31:8862–8869. - PMC - PubMed
    1. Bhatia B, et al. Tuberous sclerosis complex suppression in cerebellar development and medulloblastoma: separate regulation of mammalian target of rapamycin activity and p27 Kip1 localization. Cancer Res. 2009;69:7224–7234. - PMC - PubMed
    1. Boer K, et al. Cellular localization of metabotropic glutamate receptors in cortical tubers and subependymal giant cell tumorFs of tuberous sclerosis complex. Neuroscience. 2008;156:203–215. - PubMed
    1. Braithwaite SP, et al. Synaptic plasticity: one STEP at a time. Trends Neurosci. 2006;29:452–458. - PMC - PubMed

Publication types

MeSH terms

Substances